Introduction
In December 2019, multiple pneumonia cases infected by an unknown causative agent were identified in Wuhan, China [1]. Further investigations proved that the underlying pathogen was a novel coronavirus, the seventh human-infecting one after HCoV-NL63, HCoV-229E, HCoV-OC43, HCoVHKU1, severe acute respiratory syndrome coronavirus (SARS-CoV), and Middle East respiratory syndrome coronavirus (MERS-CoV). After identifying the genetic sequence, it was named SARS-CoV-2 by the International Committee on Taxonomy of Viruses (ICTV) [2,3]. It was officially recognized as coronavirus disease 2019 (COVID-19) by the World Health Organization (WHO) on 11 February 2020. It has spread worldwide and contributed to thousands of deaths. As a result, the WHO referred to COVID-19 as a public health emergency of international concern on 30 January 2020, and later on 11 March 2020 as a pandemic [4]. As of 13 April 2020, the number of confirmed cases and deaths of COVID-19 is 1,853,155 and 114,247, respectively [5].
Before the emergence of COVID-19, 2 other b-coronaviruses, SARS-CoV and MERS-CoV, had caused epidemics beginning in 2002-2003 in China [6-8] and 2012-2013 in Saudi Arabia [9-11], respectively. Recent investigations have shown several similarities and differences between COVID-19 and the coronaviruses mentioned above in terms of clinical, epidemiological, laboratory, and radiological characteristics [12-15]. As observed in recent studies, clinical findings during the disease course may include but are not limited to fever (81-94% of cases), cough (65-78% of cases), muscle soreness or fatigue (21-65% of cases), and acute respiratory distress syndrome (ARDS) (4-29% of cases). So, a considerable portion of COVID-19 cases may progress to life-threatening conditions [16]. To prevent or manage this, early diagnosis of the disease is critical so that the isolation, monitoring, and treatment process may begin earlier, which might lead to better disease outcomes and fewer infections in the population.
Detection of the virus genome using the reverse transcription-polymerase chain reaction (RT-PCR) technique is currently the approved method for a definite diagnosis of COVID-19. However, its sensitivity is reportedly not high enough. Also, the test is time-consuming and not widely available, and false-negative results may be present because of errors in sampling methods, sampling sites, sample processing, and incorrect timing of sampling [17,18]. On the other hand, chest computed tomography (CT) is a relatively available and non-invasive method used for identifying COVID-19 cases [19]. To apply CT imaging as a valid preliminary test, it is necessary to explain the radiological features of COVID-19. Many studies have reported radiological findings of the disease in different populations, and previously published reviews inferred some general details. Considering the numerous publications that become available every day, there is a need for a more detailed description of chest CT findings in COVID-19. Therefore, this study aims to summarize the available data regarding chest CT features in confirmed cases of COVID-19, provide more details of specific findings, clarify the findings and differences in paediatric patients, the different degrees of disease severity, and PCR-negative or non-COVID pneumonia, and evaluate the correlation between CT findings and patient outcomes.
Material and methods
The results of this meta-analysis are reported based on the preferred reporting items for systematic reviews and meta-analyses (PRISMA) statement [20].
Search strategy
We systematically searched the MEDLINE, Web of Science, and Scopus databases for relevant publications. Because of the novelty of this topic and for the reduction of publication bias, we also searched Google Scholar for the possible missing articles on other databases. Our search terms were the following: “CT”, “CT scan”, “computed tomography”, “imaging”; and “COVID19”, “SARS-CoV-2”, “Wuhan pneumonia”, “Wuhan corona”, “2019nCoV”, and “2019 novel coronavirus”. The search strategy for each database is provided with details in the supplement. No language restriction was applied. All relevant studies published between 1 December 2019 and 15 March 2020 were retrieved. We also manually searched the reference lists of reviews and relevant articles. An additional search was conducted on 4 April 2020 in MEDLINE using the same search terms.
Selection criteria
We included all peer-reviewed and non-peer-reviewed publications that had reported computed tomographic features of RT-PCR-confirmed patients with SARS-CoV-2 infection. Editorials, letters, comments, reviews, and case series with less than 10 reported cases were excluded from our search results. Two authors (P.M. and M.N.) independently conducted the title and abstract screening, and then performed a detailed review of the resulting publications. Any disagreement was consulted with another author (A.S.).
Quality assessment
We used a modified version of the Newcastle-Ottawa scale (NOS) designed for the cross-sectional studies as a tool for quality assessment [21]. This tool is concerned with three main areas of interest: sample selection, comparability of groups, and outcome. The maximum obtained score was ten stars.
Data extraction
Two authors (P.M. and M.N.) independently extracted all the relevant data about the CT features of COVID-19 patients. Because some studies had compared CT findings of confirmed COVID-19 patients with pneumonia patients of other infectious causes, the data of such patients were also retrieved with details. Extracted data consisted of the following parts: first author’s name, year of publication, possible subgroups, number of cases that underwent CT scan, number of patients with normal CT findings, ground-glass opacities (GGO), consolidation, air-bronchogram, bronchial wall thickening, bronchiectasis, crazy-paving pattern, halo sign, reversed halo sign, lymphadenopathy, pleural effusion, pleural thickening, tree-in-bud sign, cavitation, vascular dilation and thickening, bilateral involvement of lungs, peripheral distribution of inflammation, the involvement of more than one lobe, and the number of each of the involved lobes (RUL, RML, RLL, LUL, and LLL). Detailed definitions for each of these signs are provided in Table 1.
Table 1
Definition of computed tomography findings reported in this study (from the Fleischer Society: Glossary of Terms for Thoracic Imaging) [86]
Statistical analysis
All proportional and between-group meta-analyses in this study were performed using Stata release 16.0 (StataCorp, College Station, TX, USA). For proportional data, we first transformed the proportions with the Freeman-Tukey double arcsine method so that the normal distribution could be achieved and the problem with proportions being too high or too low and their confidence intervals would be resolved [22]. Reported effect estimates and confidence intervals (CI) were then back-transformed to proportions. Heterogeneity between studies was assessed using the p-value of Cochran’s Q test and its more quantified form, I2 statistics. We assessed publication bias using Egger’s test [23]. An I2 value of less than 40% was considered as an indicator of low heterogeneity between publications. Based on the results of the I2 statistics, we carried out a fixed or random effects model for meta-analysis. For proportional data, the effect size (ES) was the pooled proportion of CT features, reported with a 95% CI. For the between-group analysis, risk ratio and 95% CI were calculated. A p-value of less than 0.05 was considered significant. Because it seems that the course of the disease is generally milder in children [24], we decided to analyse paediatric cases (age < 18 years) separately (n = 147; six publications [25-30]). Also, three types of subgroup analyses were considered, to assess whether the prevalence of CT findings is different between: (1) those with mild-moderate and severe-critical disease; (2) surviving and deceased patients; and (3) those with RT-PCR-confirmed COVID-19 and those with pneumonia caused by other agents. For the severity of the disease, most studies classified their cases based on either the Guidelines for the Diagnosis and Treatment of New Coronavirus Pneumonia [31] or the American Thoracic Society guidelines for community-acquired pneumonia [32].
Results
Study selection and characteristics
Our first search resulted in 547 results. After the removal of duplications, 428 publications underwent title and abstract screening. After the exclusion of irrelevant articles based on title and abstract screening, 109 articles were assessed for eligibility by full-text screening. Among these, we found 65 studies eligible to be considered for quantitative synthesis. Detailed reasons for full-text exclusion are given in Figure 1. With the additional search, 21 new publications were identified, and finally 86 eligible articles were included in the meta-analysis. The total number of patients who underwent at least one CT scan was 7956. The number of cases with at least one CT imaging ranged from 11 to 975 in different studies. The characteristics of the included studies are provided in Table 2.
Figure 1
Flow diagram of study selection for systematic review and meta-analysis of computed tomography findings in patients with COVID-19

Table 2
Characteristics of included studies in this systematic review and meta-analysis
| Study | Author | Year | Q/A | Subgroups (if available) | All cases with CT | Ref. |
|---|---|---|---|---|---|---|
| A comparative study of chest computed tomography features in young and older adults with corona virus disease (COVID-19) | Zhu | 2020 | 9 | 72 | [135] | |
| Analysis of factors associated with disease outcomes in hospitalized patients with 2019 novel coronavirus disease | Liu | 2020 | 7 | 78 | [136] | |
| Association of radiologic findings with mortality of patients infected with 2019 novel coronavirus in Wuhan, China | Yuan | 2020 | 8 | Reports findings based on outcome (survival or death) | 27 | [51] |
| Chest CT features of COVID-19 in Rome, Italy | Caruso | 2020 | 9 | 60 | [137] | |
| Chest CT findings in coronavirus disease-19 (COVID-19): relationship to duration of infection | Bernheim | 2020 | 7 | 121 | [138] | |
| Chest CT findings in patients with corona virus disease 2019 and its relationship with clinical features | Wu | 2020 | 7 | 80 | [139] | |
| Clinical and biochemical indexes from 2019-nCoV infected patients linked to viral loads and lung injury | Liu | 2020 | 5 | 12 | [140] | |
| Clinical and computed tomographic imaging features of novel coronavirus pneumonia caused by SARS-CoV-2 | Xu | 2020 | 7 | Reports findings based on the severity of disease (mild-moderate or severe-critical) | 50 | [35] |
| Clinical and CT imaging features of the COVID-19 pneumonia: focus on pregnant women and children | Liu | 2020 | 6 | Reports findings of patients with negative PCR for SARS-CoV-2 | 34/25 PCR- | [53] |
| Clinical and high-resolution CT features of the COVID-19 infection: comparison of the initial and follow-up changes | Xiong | 2020 | 6 | 42 | [141] | |
| Clinical and immunologic features in severe and moderate forms of coronavirus disease 2019 | Chen | 2020 | 6 | Reports findings based on the severity of disease (mild-moderate or severe-critical) | 21 | [142] |
| Clinical characteristics and imaging manifestations of the 2019 novel coronavirus disease (COVID-19): a multi-center study in Wenzhou city, Zhejiang, China | Yang | 2020 | 6 | 149 | [143] | |
| Clinical characteristics of 138 hospitalized patients with 2019 novel coronavirus-infected pneumonia in Wuhan, China | Wang | 2020 | 7 | 138 | [144] | |
| Clinical characteristics of 140 patients infected with SARS-CoV-2 in Wuhan, China | Zhang | 2020 | 7 | Reports findings based on the severity of disease (mild-moderate or severe-critical) | 135 | [37] |
| Clinical characteristics of 24 asymptomatic infections with COVID-19 screened among close contacts in Nanjing, China | Hu | 2020 | 6 | 24 | [83] | |
| Clinical characteristics of 30 medical workers infected with new coronavirus pneumonia | Liu | 2020 | 5 | 30 | [145] | |
| Clinical characteristics of coronavirus disease 2019 in China | Guan | 2020 | 8 | Reports findings based on the severity of disease (mild-moderate or severe-critical) | 975 | [38] |
| Clinical characteristics of COVID-19-infected cancer patients: a retrospective case study in three hospitals within Wuhan, China | Zhang | 2020 | 7 | 28 | [146] | |
| Clinical characteristics of imported cases of COVID-19 in Jiangsu province: a multicenter descriptive study | Wu | 2020 | 6 | 80 | [147] | |
| Clinical characteristics of novel coronavirus cases in tertiary hospitals in Hubei province | Liu | 2020 | 6 | 137 | [148] | |
| Clinical course and risk factors for mortality of adult inpatients with COVID-19 in Wuhan, China: a retrospective cohort study | Zhou | 2020 | 8 | Reports findings based on outcome (survival or death) | 191 | [149] |
| Clinical features and chest CT manifestations of coronavirus disease 2019 (COVID-19) in a single-center study in Shanghai, China | Cheng | 2020 | 7 | Reports findings of patients with negative PCR for SARS-CoV-2 | 11/22 PCR– | [59] |
| Clinical features and short-term outcomes of 102 patients with corona virus disease 2019 in Wuhan, China | Cao | 2020 | 7 | CT or CXR | 102 | [150] |
| Clinical features and treatment of COVID-19 patients in northeast Chongqing | Wan | 2020 | 7 | Reports findings based on the severity of disease (mild-moderate or severe-critical) | 135 | [40] |
| Clinical features of 85 fatal cases of COVID-19 from Wuhan: a retrospective observational study | Du | 2020 | 7 | 80 | [151] | |
| Clinical features of patients infected with 2019 novel coronavirus in Wuhan, China | Huang | 2020 | 6 | 41 | [12] | |
| Comparison of hospitalized patients with acute respiratory distress syndrome caused by COVID-19 and H1N1 | Tang | 2020 | 7 | Reports findings of patients with negative PCR for SARS-CoV-2 | 73/ 75 PCR- | [60] |
| Comparison of the clinical characteristics between RNA positive and negative patients clinically diagnosed with 2019 novel coronavirus pneumonia | Li | 2020 | 6 | Reports findings of patients with negative PCR for SARS-CoV-2 | 31/ 23 PCR- | [54] |
| Coronavirus disease 2019 (COVID-19): role of chest CT in diagnosis and management | Li | 2020 | 6 | 51 | [152] | |
| Coronavirus disease 2019: initial chest CT findings | Zhou | 2020 | 9 | 62 | [153] | |
| CT features of coronavirus disease 2019 (COVID-19) pneumonia in 62 patients in Wuhan, China | Zhou | 2020 | 7 | 62 | [154] | |
| CT image visual quantitative evaluation and clinical classification of coronavirus disease (COVID-19) | Li | 2020 | 9 | Reports findings based on the severity of disease (mild-moderate or severe-critical) | 78 | [42] |
| CT imaging features of 2019 novel coronavirus (2019-nCoV) | Chung | 2020 | 5 | 21 | [19] | |
| CT manifestations of coronavirus disease-2019: a retrospective analysis of 73 cases by disease severity | Liu | 2020 | 9 | Reports findings based on the severity of disease (mild-moderate or severe-critical) | 73 | [43] |
| Diagnosis of the coronavirus disease (COVID-19): rRT-PCR or CT? | Long | 2020 | 9 | Reports findings of patients with negative PCR for SARS-CoV-2 | 36/51 PCR- | [58] |
| Early clinical and CT manifestations of coronavirus disease 2019 (COVID-19) pneumonia | Han | 2020 | 8 | 108 | [155] | |
| Emerging 2019 novel coronavirus (2019-nCoV) pneumonia | Song | 2020 | 6 | 51 | [156] | |
| Epidemiologic and clinical characteristics of 91 hospitalized patients with COVID-19 in Zhejiang, China: a retrospective, multi-centre case series | Qian | 2020 | 7 | 91 | [157] | |
| Epidemiological and clinical characteristics of 99 cases of 2019 novel coronavirus pneumonia in Wuhan, China: a descriptive study | Chen | 2020 | 8 | 99 | [13] | |
| Epidemiological, clinical characteristics of cases of SARS-CoV-2 infection with abnormal imaging findings | Zhang | 2020 | 8 | 645 | [158] | |
| High-resolution computed tomography manifestations of COVID-19 infections in patients of different ages | Chen | 2020 | 8 | 98 | [159] | |
| High-resolution CT features of 17 cases of corona virus disease 2019 in Sichuan province, China | Zhang | 2020 | 7 | 17 | [160] | |
| Imaging and clinical features of patients with 2019 novel coronavirus SARS-CoV-2 | Xu | 2020 | 9 | 90 | [161] | |
| Imaging features of coronavirus disease 2019 (COVID-19): evaluation on thin-section CT | Guan | 2020 | 8 | 53 | [162] | |
| Imaging manifestations and diagnostic value of chest CT of coronavirus disease 2019 (COVID-19) in the Xiaogan area | Wang | 2020 | 8 | 114 | [163] | |
| Initial clinical features of suspected coronavirus disease 2019 in two emergency departments outside of Hubei, China | Zhu | 2020 | 6 | Reports findings of patients with negative PCR for SARS-CoV-2 | 32/ 84PCR- | [55] |
| Initial CT findings and temporal changes in patients with the novel coronavirus pneumonia (2019-nCoV): a study of 63 patients in Wuhan, China | Pan | 2020 | 8 | 63 | [164] | |
| Novel coronavirus pneumonia (COVID-19) CT distribution and sign features | Wu | 2020 | 9 | 130 | [165] | |
| Novel coronavirus pneumonia (COVID-19) progression course in 17 discharged patients: comparison of clinical and thin section CT features during recovery | Han | 2020 | 6 | 17 | [166] | |
| Performance of radiologists in differentiating COVID-19 from viral pneumonia on chest CT | Bai | 2020 | 8 | Reports findings of patients with negative PCR for SARS-CoV-2 | 219/205 PCR- | [56] |
| Radiological findings from 81 patients with COVID-19 pneumonia in Wuhan, China: a descriptive study | Shi | 2020 | 9 | 81 | [167] | |
| Relation between chest CT findings and clinical conditions of coronavirus disease (COVID-19) pneumonia: a multicenter study | Zhao | 2020 | 9 | Reports findings based on the severity of disease (mild-moderate or severe-critical) | 101 | [48] |
| Risk factors associated with disease progression in a cohort of patients infected with the 2019 novel coronavirus | Zhou | 2020 | 5 | 17 | [168] | |
| Sensitivity of chest CT for COVID-19: comparison to RT-PCR | Fang | 2020 | 7 | 51 | [67] | |
| Temporal changes of CT findings in 90 patients with COVID-19 pneumonia: a longitudinal study | Wang | 2020 | 9 | 90 | [85] | |
| The characteristics and clinical value of chest CT images of novel coronavirus pneumonia | Zhao | 2020 | 6 | 80 | [169] | |
| The clinical and chest CT features associated with severe and critical COVID-19 pneumonia | Li | 2020 | 9 | Reports findings based on the severity of disease (mild-moderate or severe-critical) | 90 | [46] |
| Time course of lung changes on chest CT during recovery from 2019 novel coronavirus (COVID-19) pneumonia | Pan | 2020 | 8 | 24 | [170] | |
| Clinical and CT features in pediatric patients with COVID-19 infection: different points from adults | Xia | 2020 | 6 | Paediatrics | 20 | [29] |
| Clinical analysis of 31 cases of 2019 novel coronavirus infection in children from six provinces (autonomous region) of northern China | Wang | 2020 | 7 | Paediatrics | 30 | [26] |
| Analysis of CT features of 15 children with 2019 novel coronavirus infection | Feng | 2020 | 5 | Paediatrics | 15 | [30] |
| Clinical characteristics of children with coronavirus disease 2019 in Hubei, China | Zheng | 2020 | 5 | Paediatrics | 25 | [28] |
| Analysis on the clinical characteristics of 36 cases of novel coronavirus pneumonia in Kunming | Fu | 2020 | 6 | 36 | [171] | |
| Association of cardiovascular manifestations with in-hospital outcomes in patients with COVID-19: a hospital staff data | Liu | 2020 | 6 | 41 | [172] | |
| Clinical characteristics of 36 non-survivors with COVID-19 in Wuhan, China | Huang | 2020 | 6 | Reports findings based on outcome (survival or death) | 32 | [173] |
| Clinical characteristics of 51 patients discharged from hospital with COVID-19 in Chongqing, China | Liu | 2020 | 7 | Reports findings based on the severity of disease (mild-moderate or severe-critical) | 51 | [47] |
| Clinical characteristics of deceased patients infected with SARS-CoV-2 in Wuhan, China | Li | 2020 | 7 | Reports findings based on outcome (survival or death) | 161 | [50] |
| Clinical features and laboratory inspection of novel coronavirus pneumonia (COVID-19) in Xiangyang, Hubei | Cao | 2020 | 8 | Reports findings based on the severity of disease (mild-moderate or severe-critical) | 128 | [39] |
| Clinical features of 81 hospitalized patients with 2019 novel coronavirus-infected pneumonia in Jingzhou, China: a descriptive study | Zhang | 2020 | 7 | Reports findings based on the severity of disease (mild-moderate or severe-critical) | 81 | [41] |
| Clinical features of patients infected with the 2019 novel coronavirus (COVID-19) in Shanghai, China | Cao | 2020 | 8 | 198 | [174] | |
| Clinical outcomes of patients with 2019-nCoV: a preliminary summary | Zhao | 2020 | 7 | 118 | [175] | |
| Comparison of epidemiological and clinical features of patients with coronavirus disease (COVID-19) in Wuhan and outside Wuhan, China | Lei | 2020 | 5 | 20 | [176] | |
| Coronavirus disease 2019 (COVID-19) pneumonia: early stage chest CT imaging features and clinical relevance | Lu | 2020 | 6 | 91 | [177] | |
| Early prediction of disease progression in 2019 novel coronavirus pneumonia patients outside Wuhan with CT and clinical characteristics | Feng | 2020 | 7 | 141 | [178] | |
| Epidemiological and clinical characteristics of 17 hospitalized patients with 2019 novel coronavirus infections outside Wuhan, China | Li | 2020 | 7 | 17 | [179] | |
| Epidemiological and clinical features of 2019-nCoV acute respiratory disease cases in Chongqing municipality, China: a retrospective, descriptive, multiple-center study | Qi | 2020 | 8 | Reports findings based on the severity of disease (mild-moderate or severe-critical) | 267 | [44] |
| Epidemiological and clinical features of 291 cases with coronavirus disease 2019 in areas adjacent to Hubei, China: a double-center observational study | Chen | 2020 | 7 | 291 | [180] | |
| How to differentiate COVID-19 pneumonia from heart failure with computed tomography at initial medical contact during epidemic period | Zhu | 2020 | 9 | 12 | [181] | |
| Imaging profile of the COVID-19 infection: radiologic findings and literature review | Ng | 2020 | 5 | 21 | [182] | |
| Key points of clinical and CT imaging features of 2019 novel coronavirus (2019-nCoV) imported pneumonia based on 21 cases analysis | Xu | 2020 | 6 | Reports findings based on the severity of disease (mild-moderate or severe-critical) | 21 | [45] |
| Prevalence and clinical features of 2019 novel coronavirus disease (COVID-19) in the fever clinic of a teaching hospital in Beijing: a single-center, retrospective study | Liang | 2020 | 5 | Reports findings of patients with negative PCR for SARS-CoV-2 | 20/67 PCR– | [57] |
| Transmission and clinical characteristics of coronavirus disease 2019 in 104 outside-Wuhan patients, China | Qiu | 2020 | 8 | 94 | [183] | |
| A retrospective study of the clinical characteristics of COVID-19 infection in 26 children | Tang | 2020 | 5 | Paediatrics | 26 | [27] |
| Coronavirus disease-19 among children outside Wuhan, China | Chen | 2020 | 6 | Paediatrics | 31 | [25] |
| A comparative study on the clinical features of COVID-19 pneumonia to other pneumonias | Zhao | 2020 | 9 | 19 | [184] | |
| Analysis of 2019 novel coronavirus infection and clinical characteristics of outpatients: an epidemiological study from the fever clinic in Wuhan, China | Wei | 2020 | 6 | Reports findings of patients with negative PCR for SARS-CoV-2 | 511/296 PCR– | [52] |
The proportion of CT scan findings
Normal CT results
Among 80 publications, 58 had reported the number of patients without any abnormal CT findings (n = 6426). Pooled prevalence of patients with normal CT was 5% (95% CI: 0.03-0.07; p < 0.001; Figure 2). However, for paediatric patients this was higher (40%; 95% CI: 0.27-0.55; p < 0.001; Figure 3).
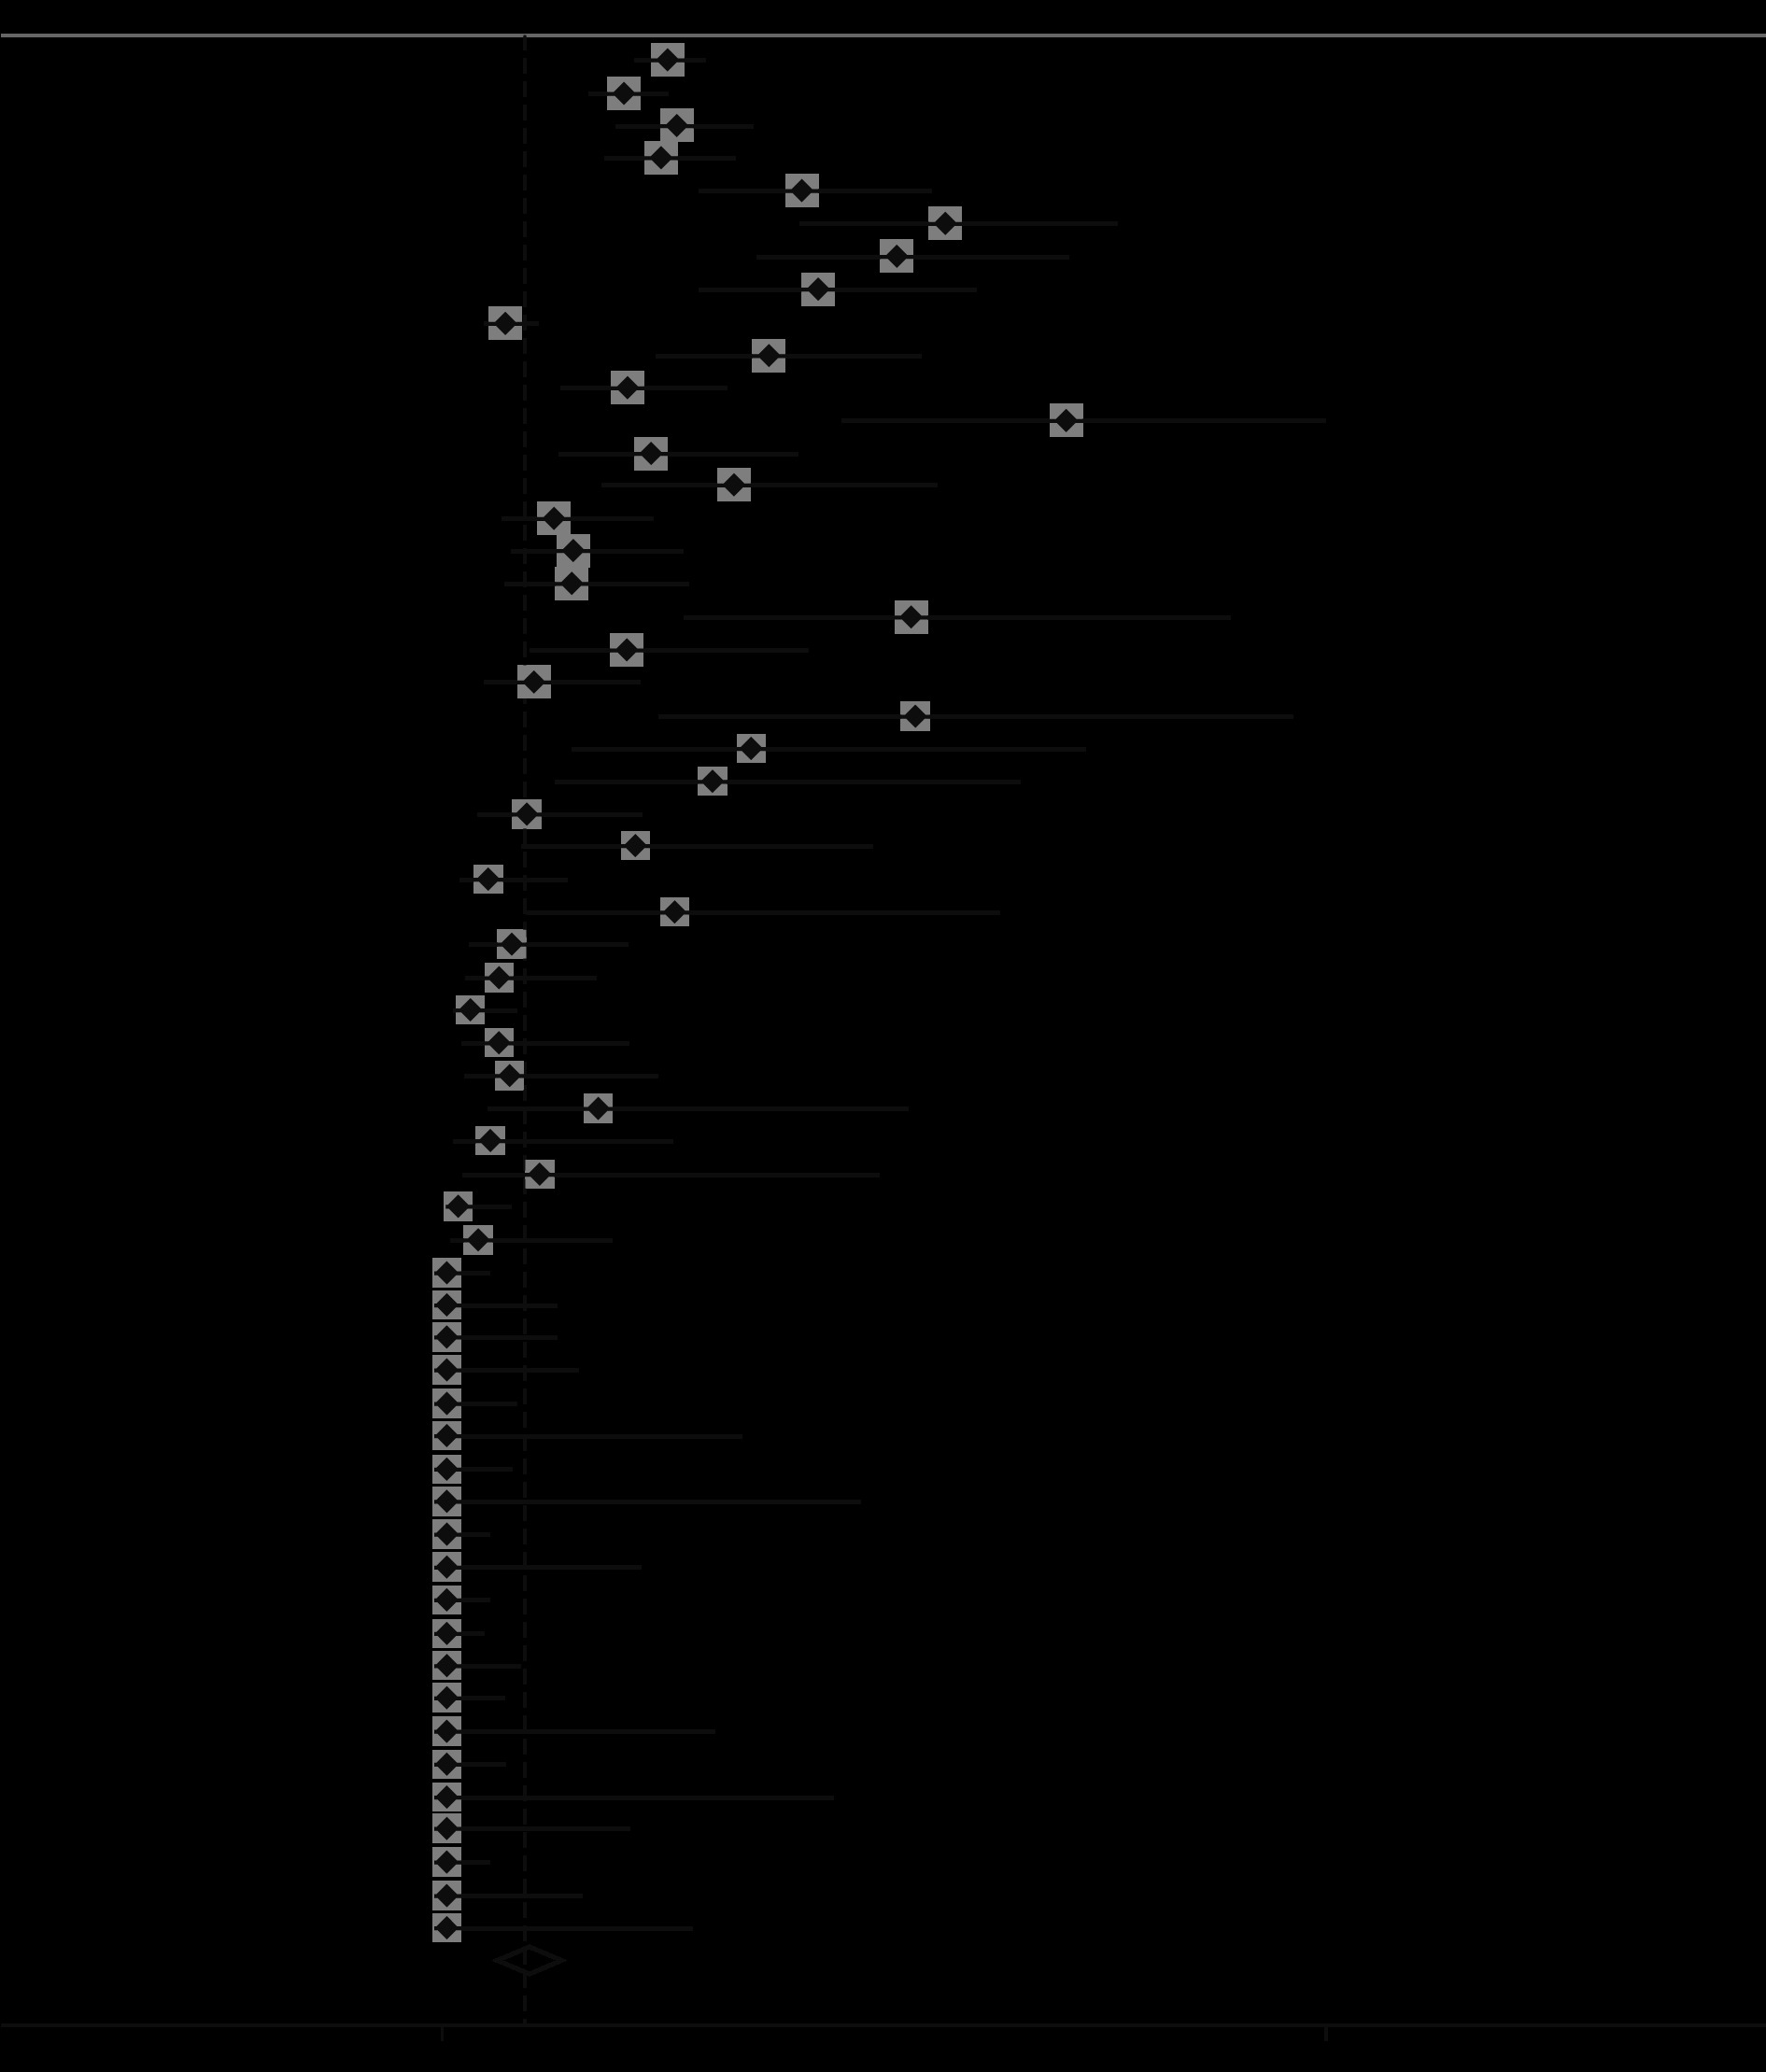
GGO
This is one of the most important CT findings suggestive of SARS-CoV-2 [33, 34]. The number of patients with GGO was reported in 59 studies (n = 5691). The pooled prevalence of GGO was 73% (95% CI: 0.67-0.78; p < 0.001; Figure 4), which makes it the most common imaging sign in patients with COVID-19. Also, GGO was found in 44% of paediatric patients with COVID-19 (95% CI: 0.26-0.63; p < 0.001; n = 65 patients; Supplementary Figure 1).
Vascular dilation/thickening
Microvascular and macrovascular dilation is probably due to inflammation and the resulting hyperaemia. Thirteen studies reported this sign, although with different nomenclature (vascular dilation, thickening, and enlargement). The pooled prevalence of this feature among COVID-19 patients was 63% (95% CI: 0.52-0.73; p < 0.001; Supplementary Figure 2).
Pattern of involvement
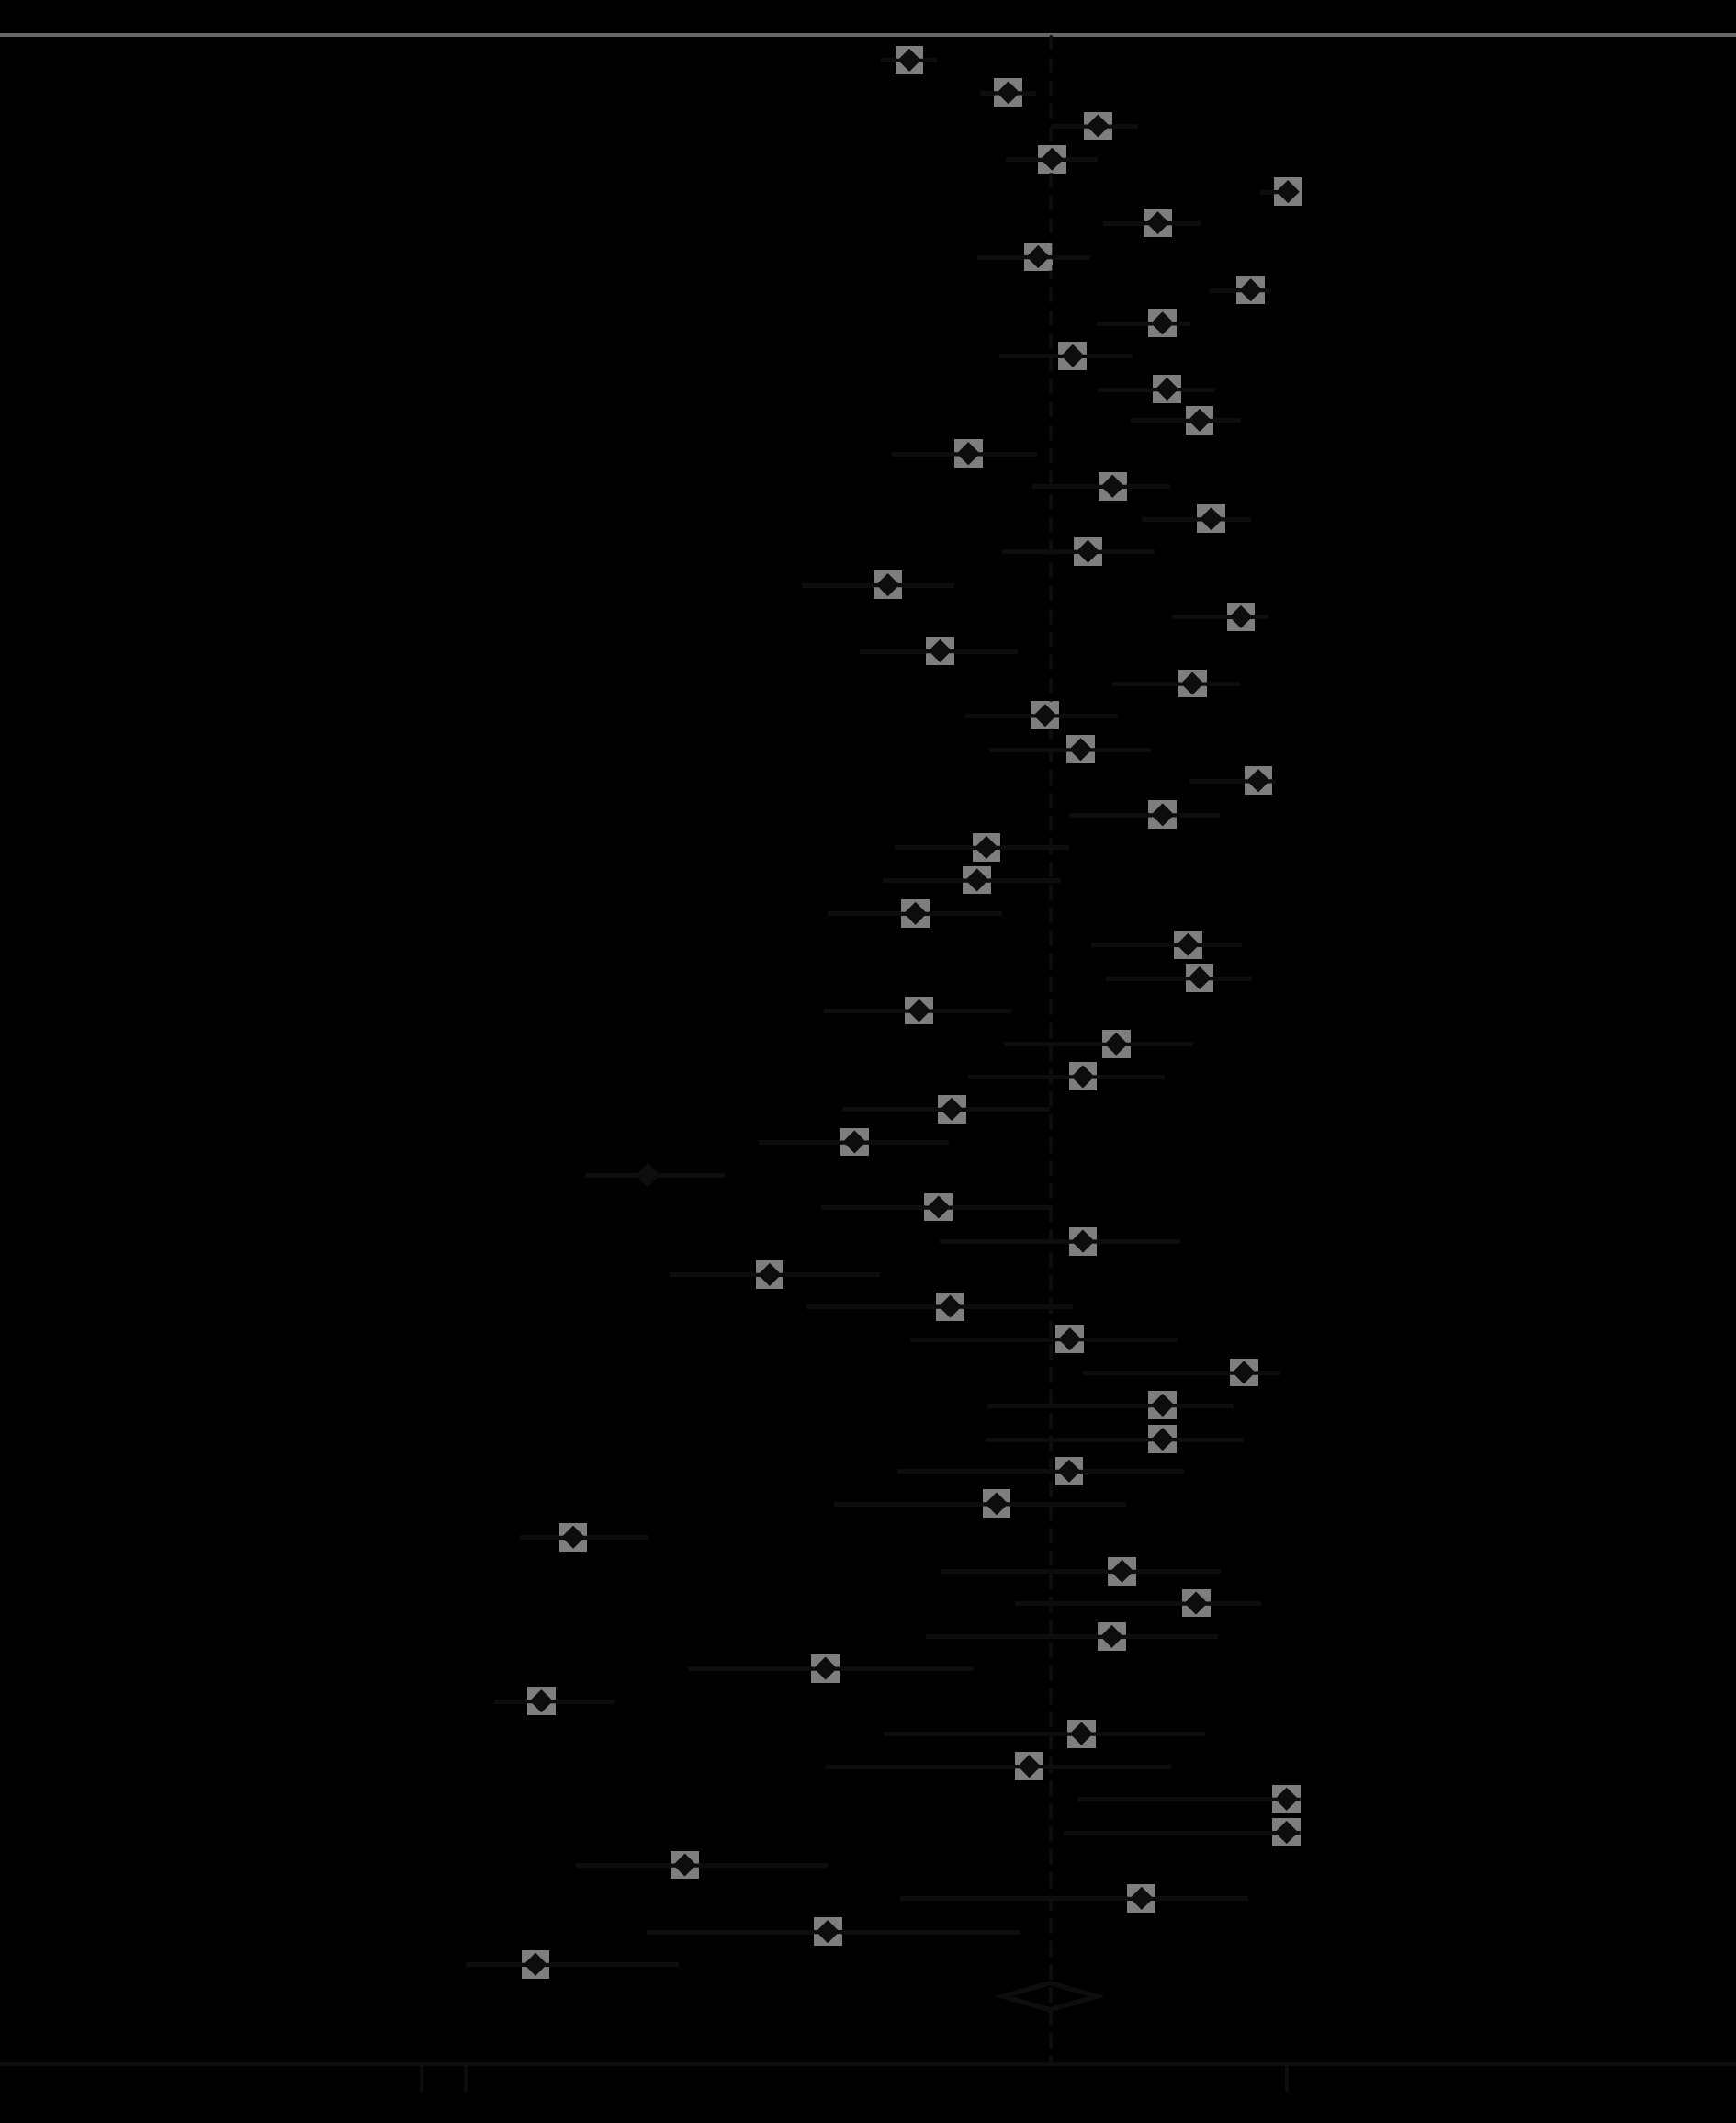
Bilateral involvement of lungs
Fifty-four articles reported bilateral involvement of the lungs (n = 5250). The proportion of patients with this feature was 78% (95% CI: 0.73-0.82; p < 0.001; Figure 5), which is the most common CT scan pattern found in COVID-19 patients in this meta-analysis. Thirty-two per cent of paediatric patients had this feature in their CT images (95% CI: 0.13-0.53; p < 0.001; n = 102 patients; Supplementary Figure 1).
Peripheral distribution
Peripheral zone of lungs is generally defined as the outer one-third on lung parenchyma. We found that in 1942 cases, 69% had lesions located in the peripheral zone of the lungs (95% CI: 0.61-0.76; p < 0.001; Supplementary Figure 2).
Involvement of more than one lobe
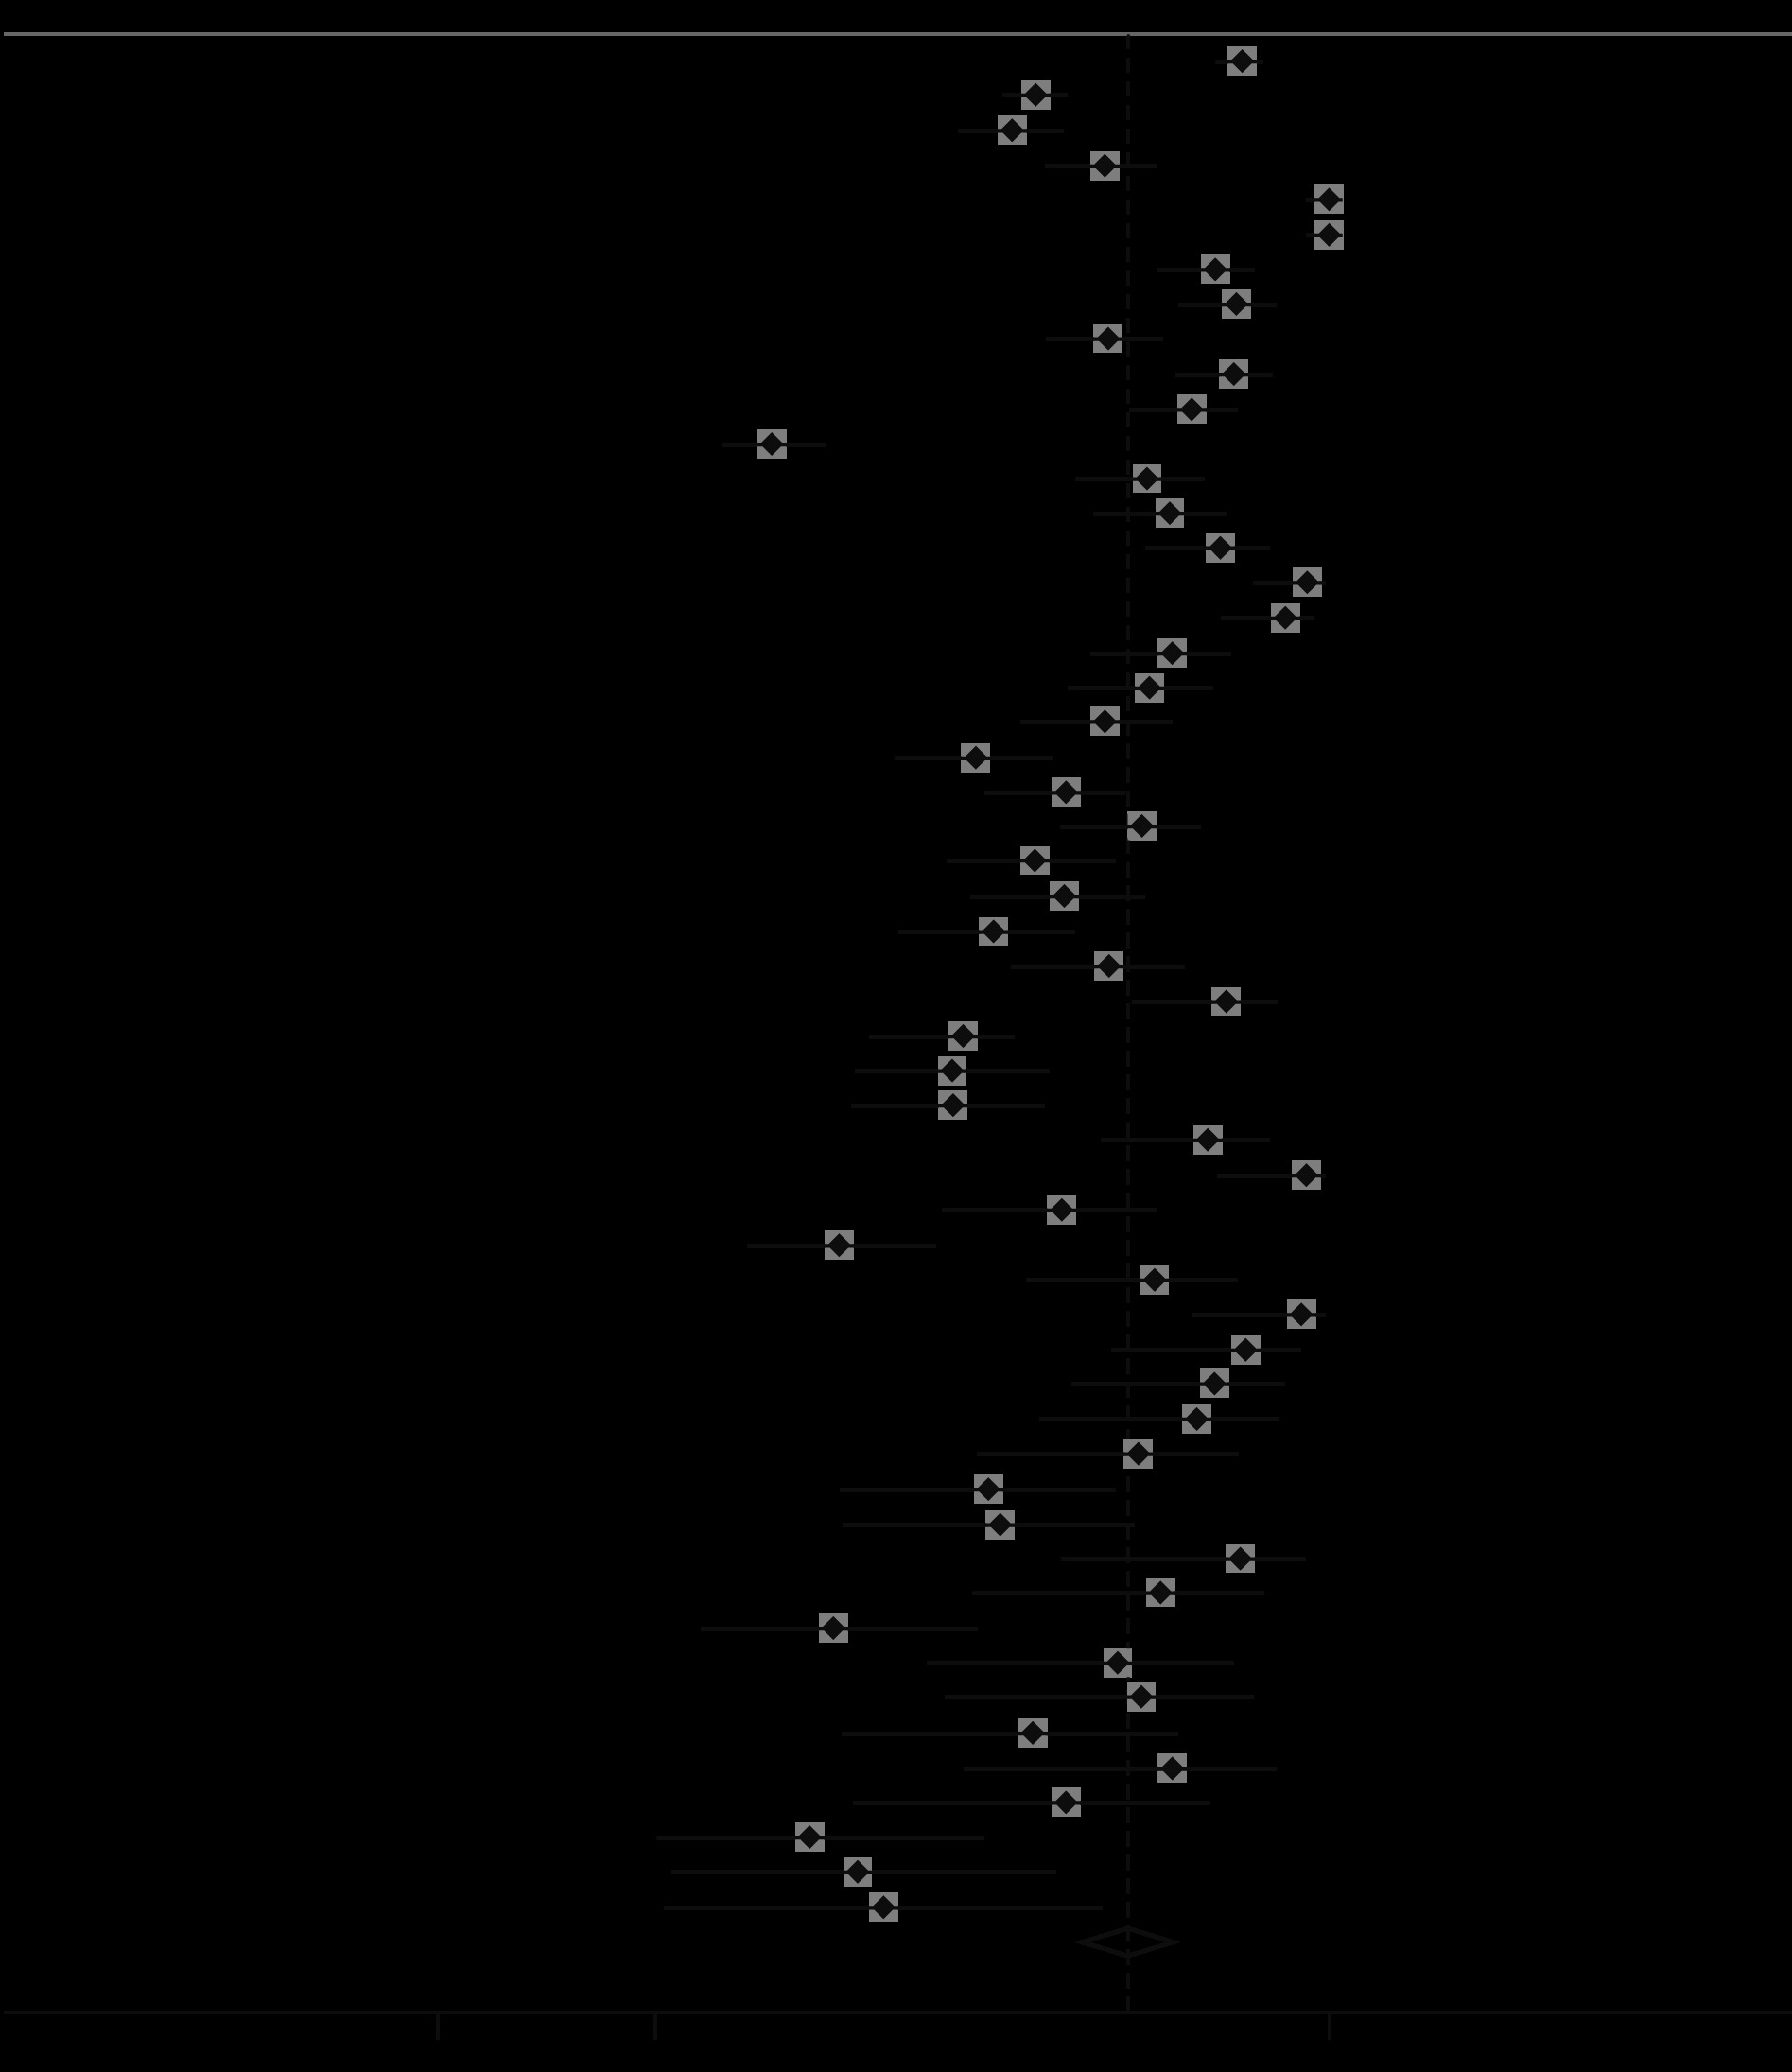
Among the included studies, a few reported detailed information about the number of involved lobes for each patient. However, because other publications just reported the proportion of cases with more than one lobe involvement, we took this as a cut-off for reporting the results. For 1687 cases, 75% had involvement of more than one lung lobe, which makes it the second most common pattern of involvement seen in CT images (95% CI: 0.68-0.82; p < 0.001; Figure 6).
Location of involved lobes
LLL and RLL were involved in 67% and 66% of patients, respectively. Proportions of patients with LUL, RUL, and RML involvement are provided in Table 3; however, they should be treated with caution due to publication bias.
Table 3
Statistics on meta-analysis of pooled prevalence of computed tomographic features in COVID-19 patients
Other features
Other more common signs we found in our meta-analysis were air-bronchogram (40%), consolidation (34%), crazy-paving pattern or paving stone sign (31%), bronchiectasis (24%), and pleural thickening (24%). No cavitation was reported in patients, and only three of 501 cases had the tree-in-bud sign. The proportion of all extracted signs and patterns, along with 95%CI, I2 statistics, and p-values for the Egger’s test and ES, are provided in Table 3 and Supplementary Figure 2. Statistics on the meta-analyses of paediatric patients are provided in Table 4.
Table 4
Statistics on meta-analysis of pooled prevalence of computed tomographic features in paediatric COVID-19 patients
Subgroup analyses
Severity
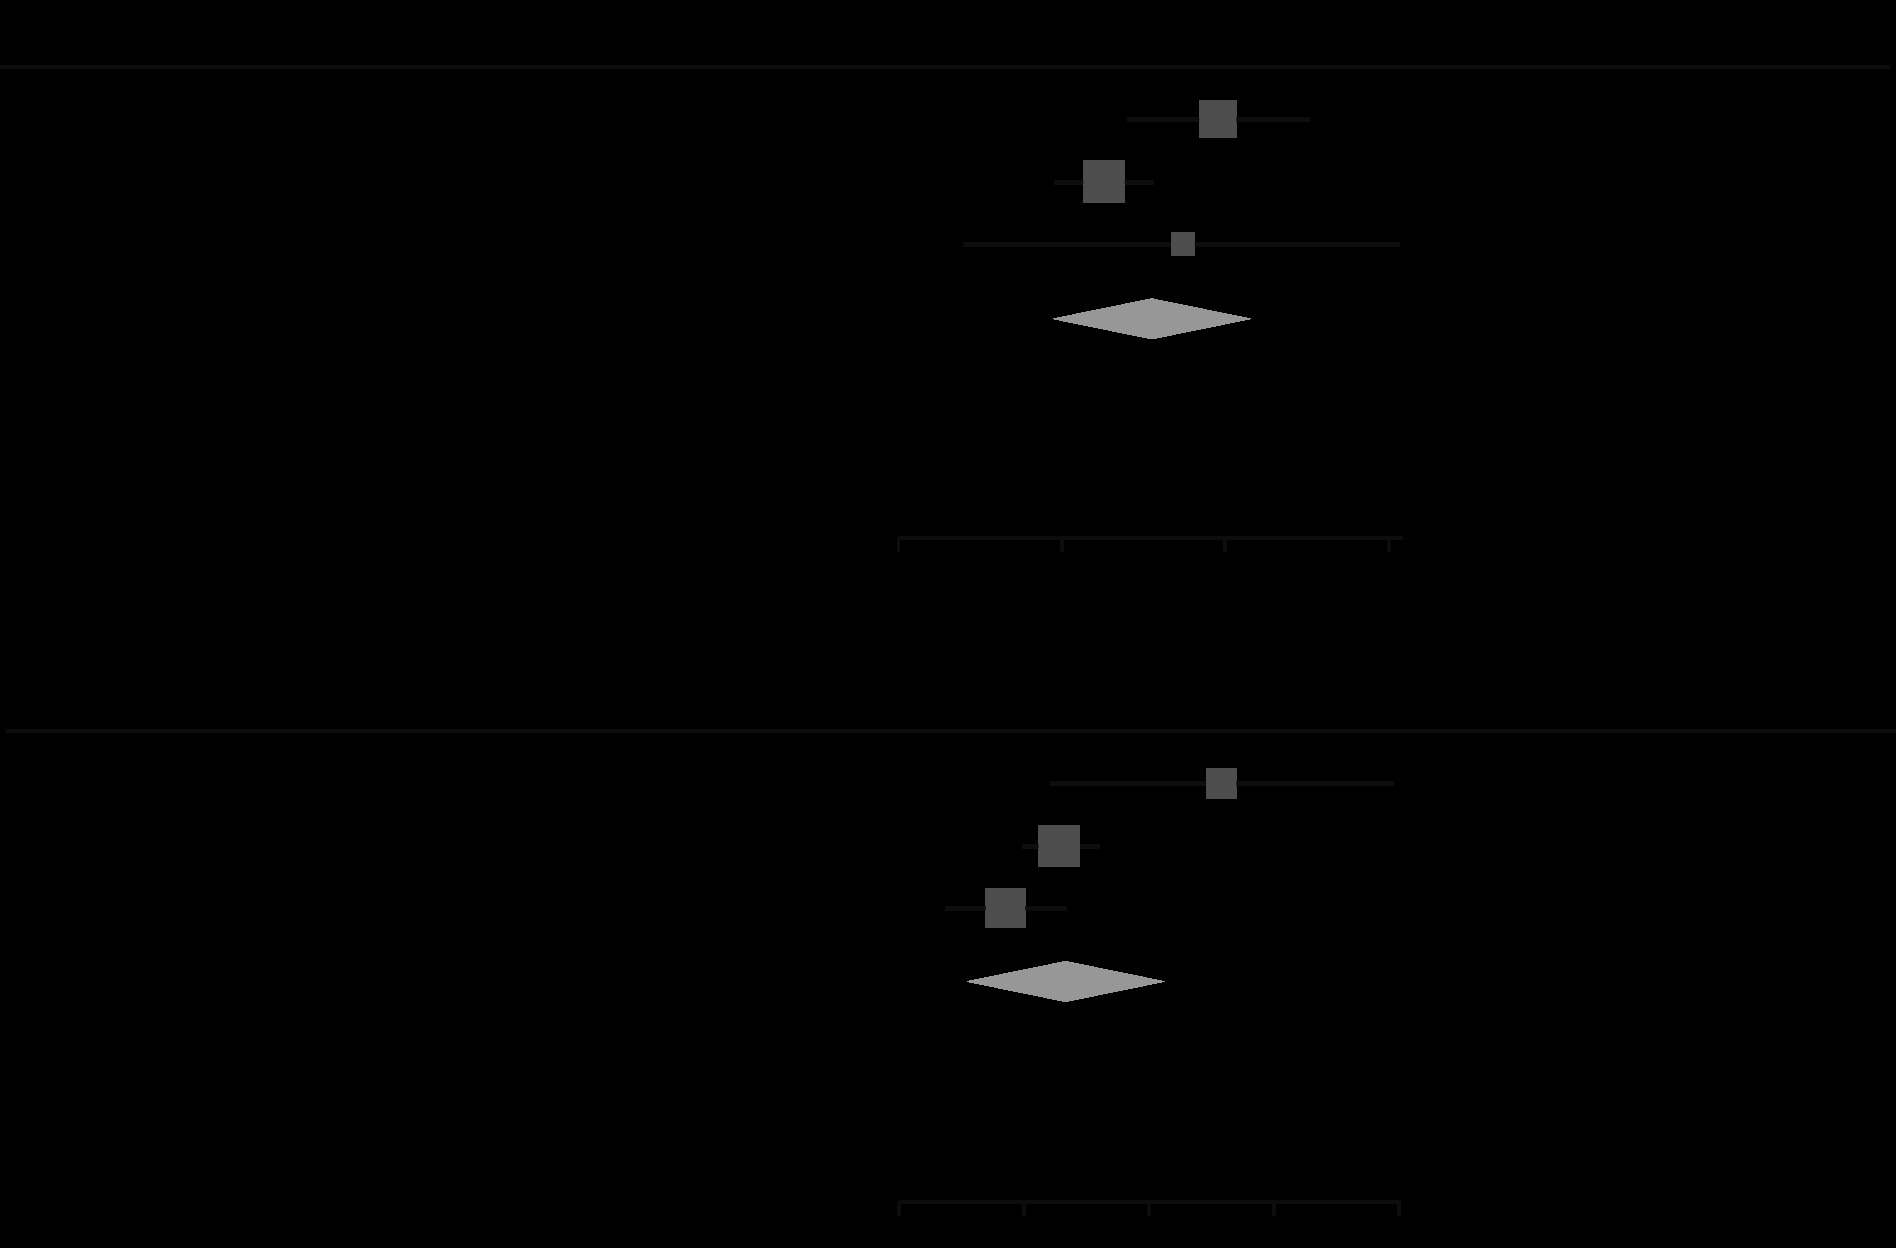
We found 14 publications that reported CT findings of patients with the severe-critical and mild-moderate disease, separately [35-48]. There were 1707 and 494 patients with mild-moderate and severe-critical situations, respectively. Subgroup analysis of these patients showed that those with severe-critical illness had a higher risk of having bilateral involvement (RR, 1.37; 95 CI: 1.06-1.78; p = 0.02; Figure 7) and consolidation (RR, 3.12; 95 CI: 1.57-6.23; p < 0.001; Figure 7). Also, the severe-critical group had a lower proportion of patients with normal CT, compared with the mild-moderate group (RR, 0.31; 95 CI: 0.18-0.53; p < 0.001). The details of these findings are summarized in Table 5 and Supplementary Figure 3.
Figure 7
Forest plot comparing the prevalence of consolidation (up) and bilateral involvement (down) between severe-critical and mild-moderate patients. REML – restricted maximum likelihood

Table 5
Statistics on subgroup analysis of COVID-19 patients, based on severity, outcome, and PCR results
Outcome
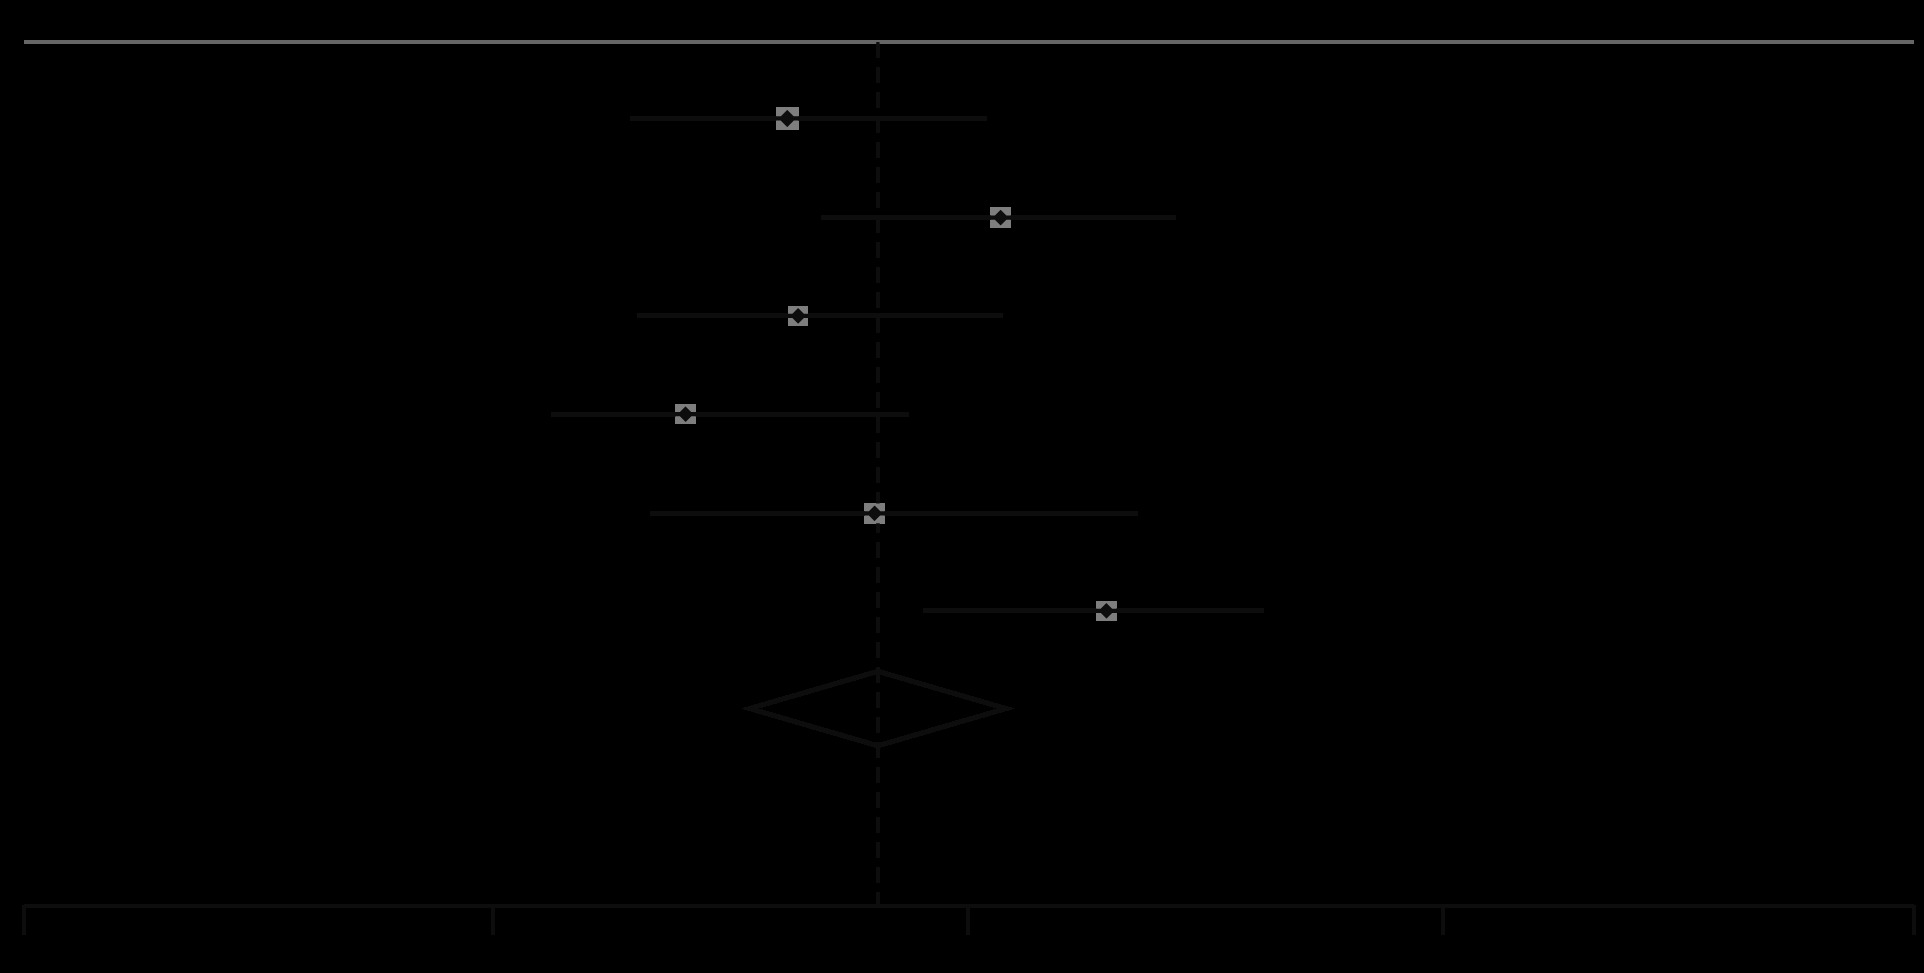
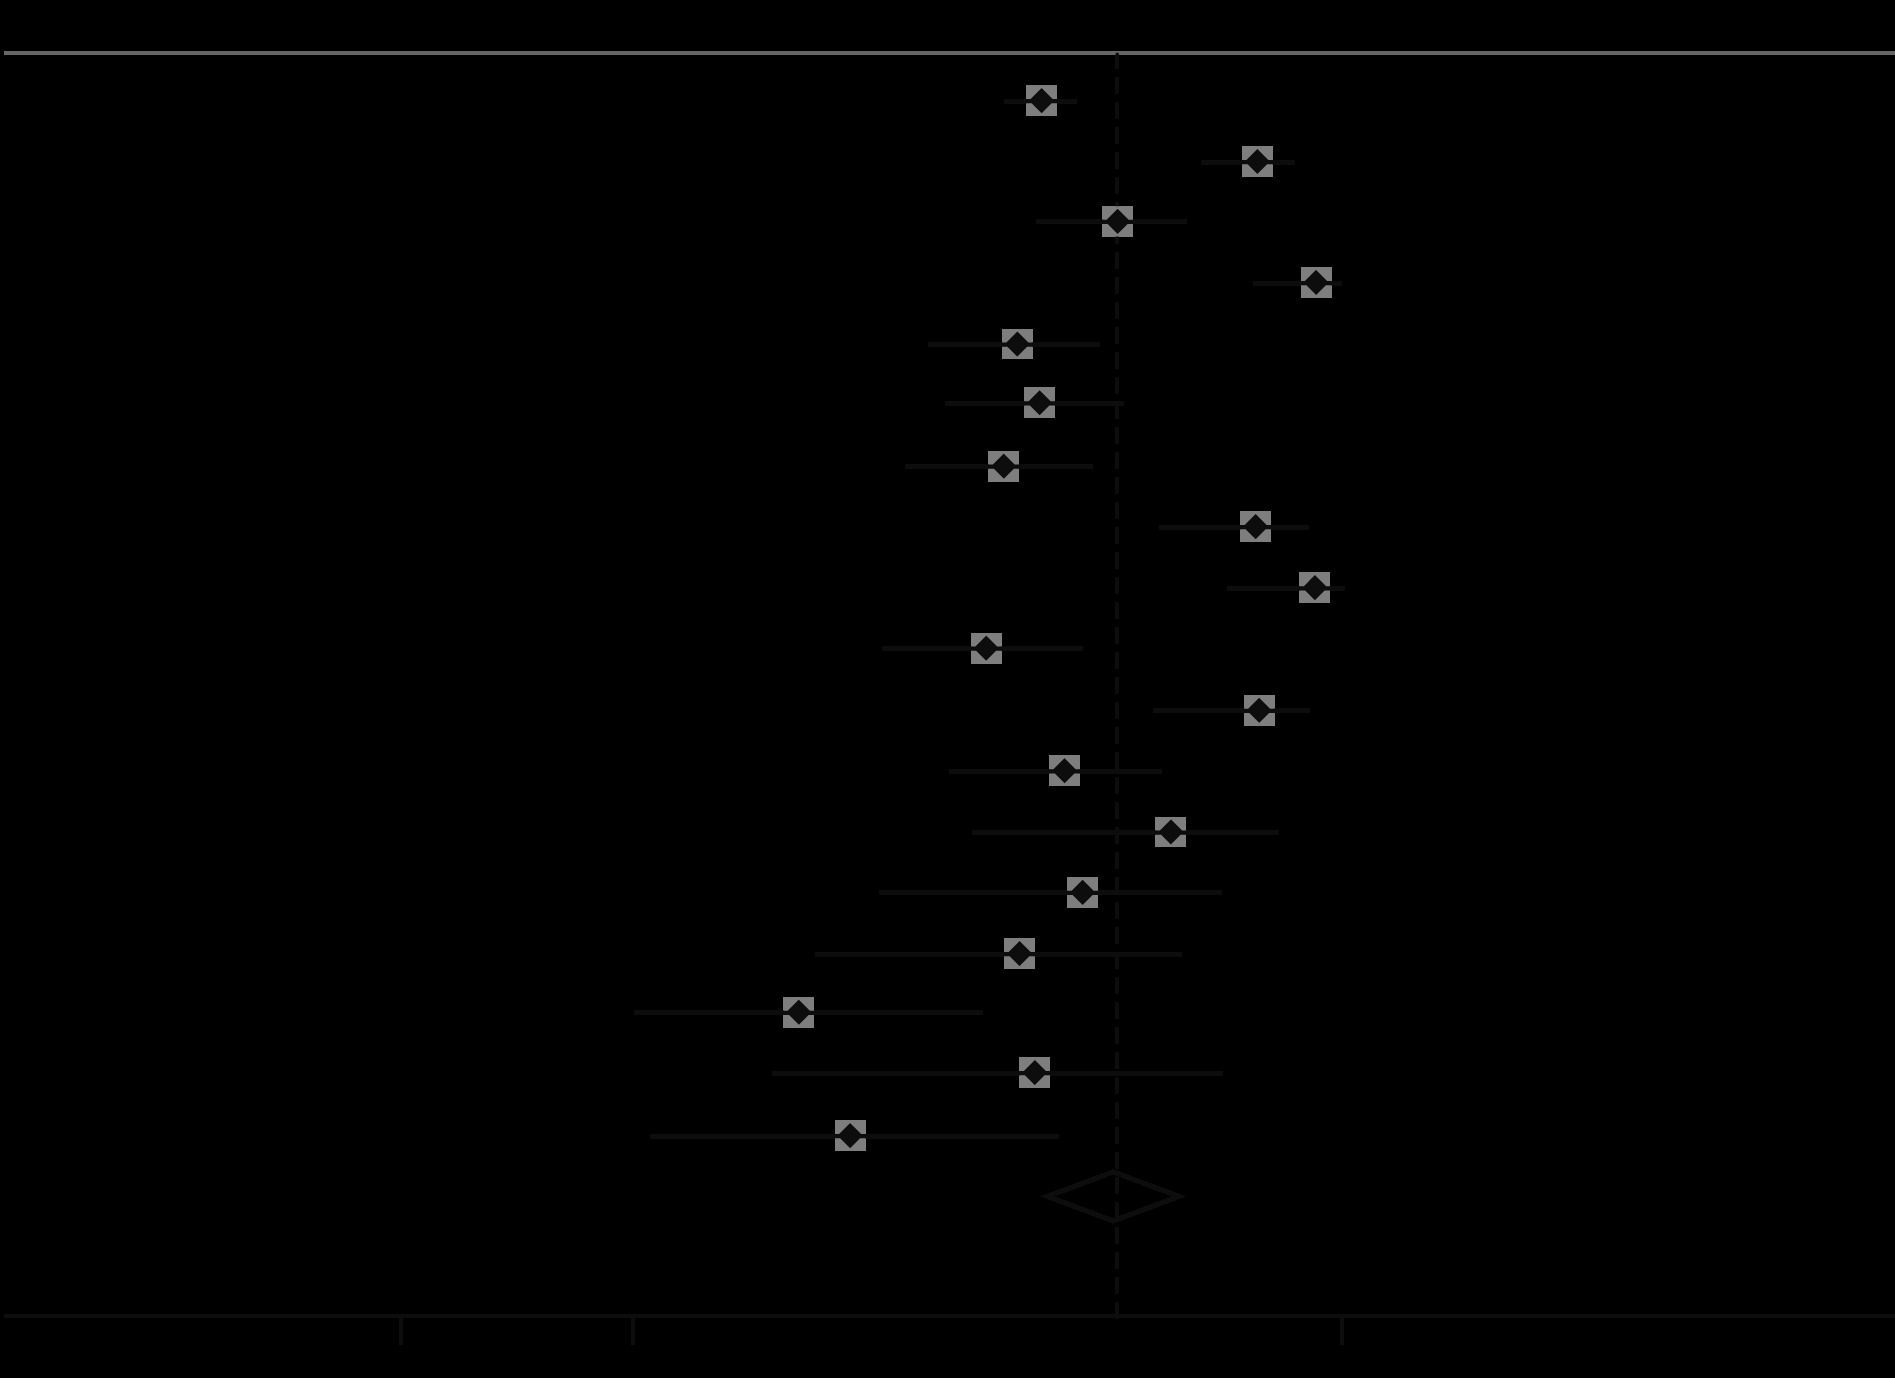
We found three studies [49-51] comparing CT findings of living and dead COVID-19 patients. It turned out that the presence of GGO is not associated with a worse outcome (RR, 1.97; 95% CI: 0.48-8.00; p = 0.34; Figure 8), but bilateral involvement with an increased risk of mortality (RR, 3.19; 95% CI: 1.07-9.49; p = 0.04; Table 5 and Figure 8).
Absence of SARS-CoV-2
Nine studies [52-60] compared imaging findings of pneumonia patients with confirmed COVID-19 (n = 968) to those without RT-PCR confirmation of the infection with SARS-CoV-2 (n = 821). COVID-19 cases had a higher risk of having GGO (RR, 1.45; 95 CI: 1.13-1.86; p < 0.001; Figure 9), but there was no significant difference between the presence of pleural effusion, positive CT findings, and bilateral involvement in two groups. However, non-COVID-19 patients showed an increased risk of having consolidation (RR, 1.23; 95 CI: 1.09-1.39; p < 0.001; Figure 9). Detailed information is provided in Table 5 and Supplementary Figures 4 and 5.

Discussion
COVID-19 continues to spread globally as there are thousands of confirmed cases and deaths reported every day and more than 85,000 deaths in 210 countries up to 9 April 2020 [5]. With such a relatively unknown virus causing a pandemic, further studies, data gathering, and evaluation seem necessary. Early and fast detection of present cases, in such conditions with up to 80% prevalence of patients with mild symptoms and asymptomatic carriers [61,62], and long-term stability of the underlying virus on different surfaces [63], leads to better isolation, treatment, and monitoring of patients. This can also improve disease outcomes, reduce costs, and ease the control of this progressing pandemic [64,65].
Chest CT evaluation is one of the most important aspects of the diagnostic process in suspected COVID-19 patients. RT-PCR, currently being the recommended test for laboratory confirmation of the disease [66], has its own limitations, as previously discussed, such as being time consuming and not having adequate sensitivity, especially early in the infection course [67]. As a result, chest CT may become more important in confirming cases in need of hospital admission, isolation, etc. Despite being relatively sensitive in detecting pneumonia patients [67,18], chest CT may not have adequate specificity for COVID-19 in single images without detailed assessment [68]. In addition, high cost and relatively lower accessibility of chest CT in western countries, as well as development of more rapid RT-PCR testing methods have limited CT use in those regions [69,70]. In order to gather the information needed for accurate evaluation of chest CTs by healthcare providers, we aim to provide a more detailed systematic review of chest CT findings and further evaluate them in specific subgroups.
Overall radiographic features
Normal chest CT was seen in only 5% of our cases. This, along with some other previously published studies, supports the fact that chest CT is a sensitive diagnostic tool that is appropriate for screening suspected patients, especially in epidemics [67,18]. Common findings in viral pneumonias include patchy or diffuse GGOs and reticulations. Consolidations may be present or absent [71]. Consistent with this phenomenon, our study results show that the most common radiological finding among COVID-19 patients is GGO, followed by vascular thickening (dilation), air bronchogram, and consolidation (observed in 73%, 61%, 41%, and 34% of cases, respectively). Other probable radiologic signs include crazy paving pattern (27%), pleural thickening (24%), bronchiectasis (24%), and halo sign (21%). Pleural effusion, reversed halo sign, and lymphadenopathies were rare, and almost no cases were seen with tree-in-bud sign or cavitations. A relatively low proportion of consolidation positive chest CTs may be a finding that differentiates SARS-CoV-2 infections from those caused by MERS-CoV and SARS-CoV. Conversely, GGOs are seen commonly in patients infected with all three epidemic-causing coronaviruses [72].
Distribution
Among five lung lobes, the left lower and right lower lobes were more likely to be involved in COVID-19 patients, as seen in 67% and 66% of cases, respectively. The least involved lobe was the right middle lobe. So, the infection is more common in the lower lobes, is usually bilateral (78%), and frequently involves more than one lobe (76%) in peripheries (68%). Lesions are usually multifocal (66%), and diffuse distribution (8%) is not common. These findings are also in favour of the distribution patterns proposed previously [73-76].
Concerning the distribution of different lesions observed in COVID-19, peripheral distribution and lower lung infiltrations are the features in common with MERS-CoV and SARS-CoV [72].
Paediatric population
It was previously observed that the disease course might have a milder pattern in children, with a higher proportion of asymptomatic carriers present [77,78]. In our study, a pooled prevalence of 40% was observed for normal chest CTs. Even considering the 95% CI, it is a significantly lower percentage compared with our general population. This implies that chest CT has lower sensitivity for identifying patients in the paediatric group, and relying on chest CT findings may increase the risk of missing patients with normal chest CTs. As a result, and considering the higher proportion of asymptomatic carriers in this age group, an integrated diagnostic approach that relies on thorough examination of clinical findings, exposure history, laboratory results, imaging, and RT-PCR tests might be a better option in children with suspected novel coronavirus infection. In addition, bilateral and unilateral involvement in chest CT images shows closer proportions in our findings, and GGOs are less common. This can mean that the typical imaging findings in children may also differ from those observed in the general population of COVID-19 patients.
Severity
In this meta-analysis, we tried to evaluate the differences in chest CT findings between the severe/critical group and mild/moderate group, classified based on the Guidelines for the Diagnosis and Treatment of New Coronavirus Pneumonia or the American Thoracic Society guidelines for community-acquired pneumonia.
In our study population for disease severity, 25% of cases were classified as severe/critical, considering the 19% report in a study on 72,314 confirmed and suspected COVID-19 patients in China [79]. According to their chest CT findings, it is inferred that the tendency towards developing consolidations and bilateral infiltrations is higher in patients with severe/critical disease. On the other hand, normal lung CT scan had a higher proportion in the mild/moderate group. Like in severe cases of MERS-CoV and SARS-CoV, pleural effusion is a radiological finding with greater prevalence in severe/critical SARS-CoV-2 infection [72]. This, combined with the clinical and laboratory data, may help in the classification of patients into severity groups and guide clinicians in choosing the subsequent plans accordingly.
Outcome
Other than diagnostic values of chest CT, its findings might be useful in predicting disease outcomes and patient prognoses in COVID-19. Regarding the outcome, bilateral involvement of lung parenchyma was associated with a higher risk of mortality. This finding is in accordance with the reports of a recent preprint article showing that the elevated level of inflammatory cytokines (CCL7, CXCL10, and IL-1 receptor antagonist) is associated with the extent of lung injury and a fatal outcome [80].
Pneumonia patients without confirmed SARS-CoV-2 infection
In this subgroup meta-analysis, we compared chest CT findings in conformed COVID-19 pneumonia cases with the negative-PCR group, including suspected patients without PCR confirmations and non-COVID pneumonias such as H1N1 influenza infection [81]. Consolidation, which was observed more commonly in severe/critical patients than in mild/moderate ones, had a higher chance for development in non-COVID pneumonias. In other words, the interpretation for observing consolidations in chest CTs depends on the groups we want to differentiate. If severity of the COVID-19 pneumonia is the question, consolidation favours severe/critical disease. Despite that, if we are going to differentiate COVID-19 pneumonias from non-COVID ones, consolidations in chest CT images make COVID-19 diagnosis less likely. After all, other diagnostic methods may be useful in differentiating such conditions.
Asymptomatic infection
CT abnormalities can also be present in COVID-19 patients without clinical symptoms. Wang et al. reported that 37 of 55 asymptomatic patients (67.2%) had abnormalities in their chest CT scans [82]. Similar observations were reported in two other studies, in which 17 of 24 [83] and 12 of 13 [84] asymptomatic patients had positive CT results (70.8% and 92.3%, respectively). However, due to insufficient data, we could not perform a meta-analysis of the imaging features of asymptomatic patients.
Limitations
This systematic review has several limitations. The interval between the initiation of clinical symptoms and the acquisition of the first CT scan is an important factor because the evolution of lesions seems to occur after the early phase of the disease [85]. However, due to significant heterogeneity among the “first symptom first-CT” intervals in different studies, we did not consider this in our meta-analysis. Moreover, for the definitions of chest CT features, some studies used the Glossary of Terms for Thoracic Imaging by the Fleischer Society [86], but others just reported the findings without an exact denotation. Unfortunately, we also did not consider the underlying conditions and risk factors of patients, which are shown to be important prognostic factors [49,87]. Regarding paediatric patients, there were only six publications that had reported CT findings of 147 paediatric patients separately. Another limitation of this meta-analysis is that the follow-up duration of three publications comparing survivors and deceased patients was also different. Now, there are more than 100000 cases of COVID-19 in the USA, Spain, Italy, Germany, and France, but most of the included publications in this meta-analysis belong to China. In addition, for the calculation of the prevalence of bilateral involvement, we had to impute the number of cases for a few studies. This was because such papers reported only the numbers of patients with positive CT findings and those with unilateral involvement. As a result, we presumed bilateral involvement to be equal to the difference between these two values. It is worth mentioning that the results of this meta-analysis are all based on the proportion of patients with different CT features. During the full-text screening, we found some studies with quantitative reports of CT findings (e.g. CT scores, the total number of lesions and involved segments, the volume of involved lung tissue, etc.), but because of the extreme heterogeneity of scales and reporting methods, we did not include them in the analysis. Among the 86 included studies, most are retrospective. This implies the urgent need for more prospective cohort studies with control of confounding factors, which hopefully will result in a more accurate comparison of clinical and imaging features. Finally, the potential correlation between CT symptoms within each patient would imply the importance of the reader experience and performance. However, the available evidence is not sufficient to analyse the effect of the learning curve in this regard.
Conclusions
The pandemic of COVID-19 [88,89] has posed challenges to health care systems [90] with prevention [91,92], diagnosis [93], treatment [91,94-104], and management [99,105,106] in both adult and paediatric settings [107]. Recent research could improve our understanding of immunopathogenesis [96,97,101,102,108-120,] and proximal origin of the virus [121,122]. However, no specific treatment and prevention has been developed, and the pandemic continues to affect multiple organs and systems and people of diverse immunogenetic background [109, 111,113,114,118,123-128].
In conclusion, chest CT can be a relatively sensitive and fast tool for distinguishing COVID-19 in the adult population. However, because of the relatively low incidence of pulmonary lesions detectable by CT, it might not be an appropriate diagnostic tool for paediatrics. SARS-CoV-2-infected patients show different patterns of lung involvement in the chest CT images, with similarities and differences with other viral types of pneumonia. Regarding what we observed, COVID-19 patients most commonly present with GGO, with or without air bronchogram and consolidations, with the lower lobes being more dominantly involved. Further studies are required for a more accurate interpretation of CT features in patients with COVID-19 concerning disease severity and outcomes. Also, given the risk of re-infection [129], it would be interesting to compare CT findings between people with first infection and people with re-infection. Scientific collaboration with systemic knowledge production [130-133] is needed in such a critical condition [134] to deal effectively with a pandemic that has caused changes to the humanity in numerous dimensions [185].