Introduction
The novel coronavirus (2019-nCoV or COVID-19), which initially emerged in Wuhan, Hubei, China in late December 2019, is currently known as a global health crisis [1]. The virus had spread rapidly around the world and was announced as a pandemic by the World Health Organization (WHO) on 11 March 2020. This highly contagious virus can result in severe pneumonia and even death [2,3]. As of 14 January 2022, over 321 million confirmed COVID-19 cases with more than 5 million deaths globally have been reported, involving 222 countries and territories [4]. The most common clinical manifestations of COVID-19 are fever, dry cough, tiredness, acute respiratory distress, and gastrointestinal symptoms [3,5].
The gold standard approach for detecting COVID-19 is the reverse transcription polymerase chain reaction (RT-PCR) to detect viral RNA from sputum or nasopharyngeal swab [5-7]; however, several studies show that the sensitivity of RT-PCR is relatively low (approximately 71%) at the initial presentation of the disease, resulting in a large number of false-negatives [7,8]. Furthermore, RT-PCR takes considerable time to obtain the results [7]. Also, the availability of RT-PCR tests is limited owing to the shortage of equipment and materials [7]. Taken all together, the aforementioned drawbacks of RT-PCR assay limit the rapid detection of COVID-19 as soon as possible in order to isolate infected cases.
To facilitate COVID-19 detection, medical imaging techniques such as chest X-ray images and computed tomography (CT) scans have been proposed as an ultra-fast alternative solution to RT-PCR for rapid screening and detection of COVID-19 [9-11]. Notably, chest CT plays a pivotal role in diagnosis and follow-up [8]. Furthermore, CT imaging can not only quantitatively assess COVID-19 but can also play an important role in monitoring the clinical course [12]. In contrast to RT-PCR, studies demonstrated that chest CT is more sensitive for detecting COVID-19 [7,8]. A recent study reported that chest CT exhibits a sensitivity of more than 88% in the detection of suspected COVID-19 cases with negative RT-PCR at the initial presentation [9]. The essential radiological features that can clearly distinguish COVID-19-infected regions on chest CT scans are ground glass opacity (GGO), pleural effusion, and lung consolidation [9,10,12]. It is worth mentioning that CT scans also show lung manifestations related to other types of pneumonia that are similar to COVID-19 [12]. Consequently, it is difficult to differentiate between COVID-19 pneumonia and other types of pneumonia [12]. Moreover, in clinical practice, evaluation of medical images is done manually, which is a tedious, time-intensive task, and which is often highly influenced by personal bias and clinical experience [13,14]. Also, interpreting CT scan images with a high number of slices increases the workload of radiologists. Besides, manual delineation of COVID-19 lesions on the chest CT also is a tedious and time-consuming job, and inconsistent contouring can also result in assessment discrepancies [15]. In clinical practice, image segmentation can be considered an important task [13]. The aim of image segmentation is to separate and label regions of interest (ROI) for quantitative assessment [13].
To address the aforementioned challenges, clinical decision support systems based on artificial intelligence are urgently needed to automatically segment COVID-19-infected areas at lung level in the images. In recent years, there has been growing interest in the use of deep-learningmethods, a branch of artificial intelligence and machine learning, which can be used for biomedical images classification and segmentation [16-20]. Toward this end, the purpose of this study was to apply deep-learning algorithms for automated segmentation of COVID-19 lesions on chest CT scans.
Material and methods
Dataset
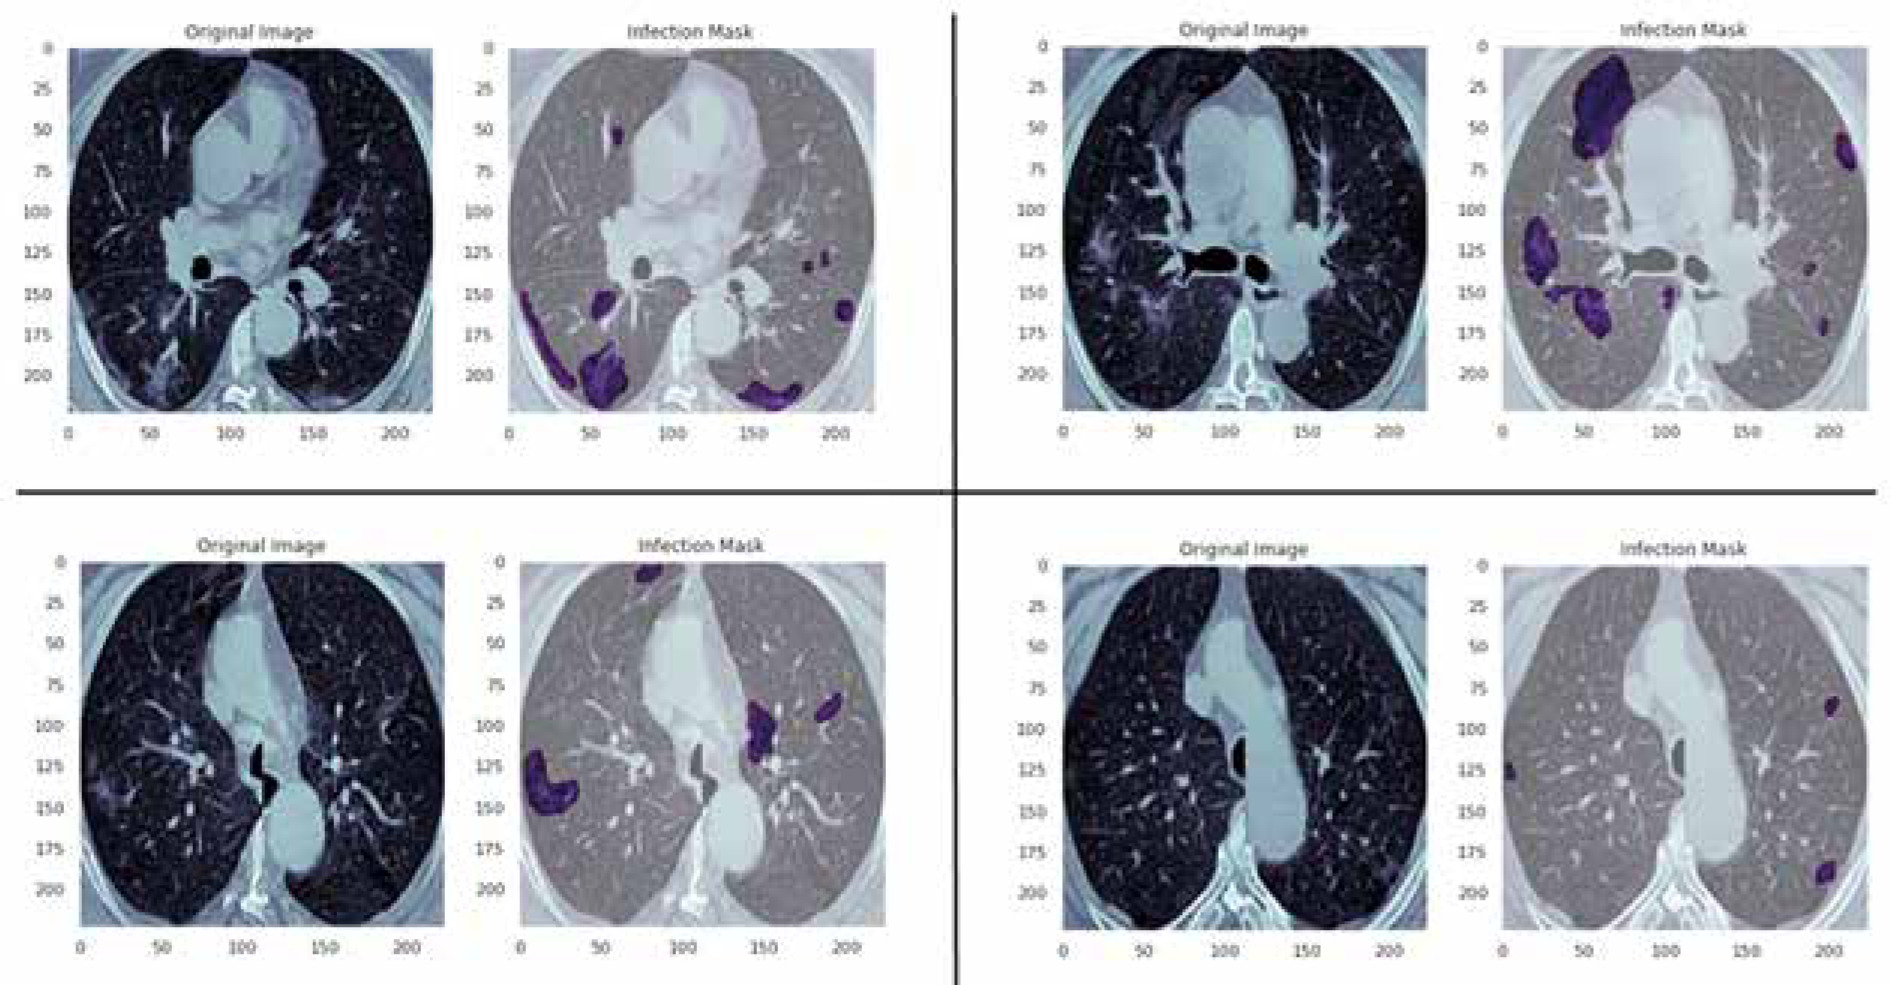
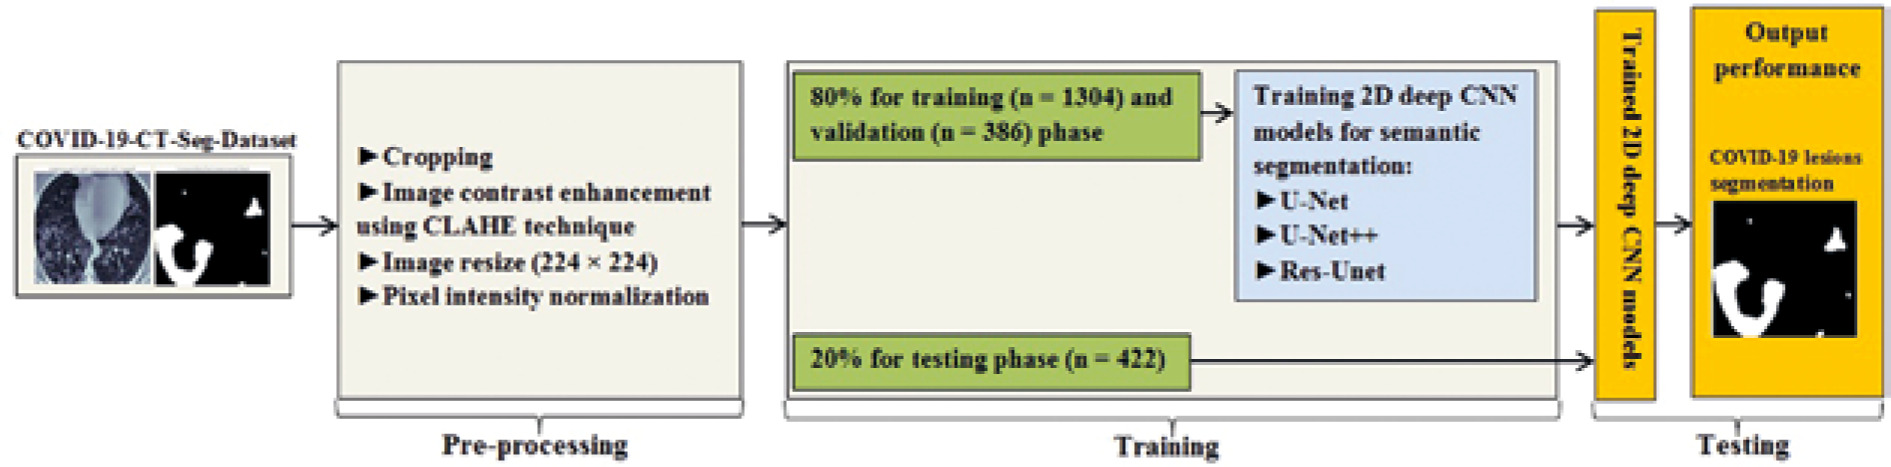
In this study, data were collected from the COVID-19-CT-Seg-Dataset (available in: https://zenodo.org/record/3757476), which is a publicly available chest CT dataset of COVID-19 proposed by Jun et al. [21]. The dataset consists of 20 labelled COVID-19 chest CT volumes with annotations of left lung, right lung, and COVID-19 lesion infections. For each annotation, 2 radiologists with 5 years of experience performed the annotation, and an experienced radiologist with more than 10 years of experience verified it. CT scans were collected from 2 sources (each source with 10 patients) including the Coronacases Initiative and the Radiopaedia website (Radiopaedia.Org, the Wiki-Based Collaborative Radiology Resource, https://radiopaedia.org/). The COVID-19-CT-Seg-Dataset contains 3520 slices of CT images with its labelled images. CT scans had dimensions of 512 × 512 (Coronacases Initiative) or 630 × 630 (Radiopaedia) for the slices. In the current study, we used a total of 2112 images, randomly divided into 1304 CT images as training samples, 386 CT images for validation, and 422 images for testing. Dataset sample CT images along with their ground truth are shown in Figure 1. An overview of the workflow used for COVID-19 lesion segmentation is depicted in Figure 2.
Figure 1
Examples of computed tomography images along with corresponding mask from the COVID-19-CT-Seg-Datase
The study was approved by the ethics committee of Hormozgan University of Medical Sciences, BandarAbbas, Iran. Ethics No. is IR.HUMS.REC.1399.412.
Pre-processing
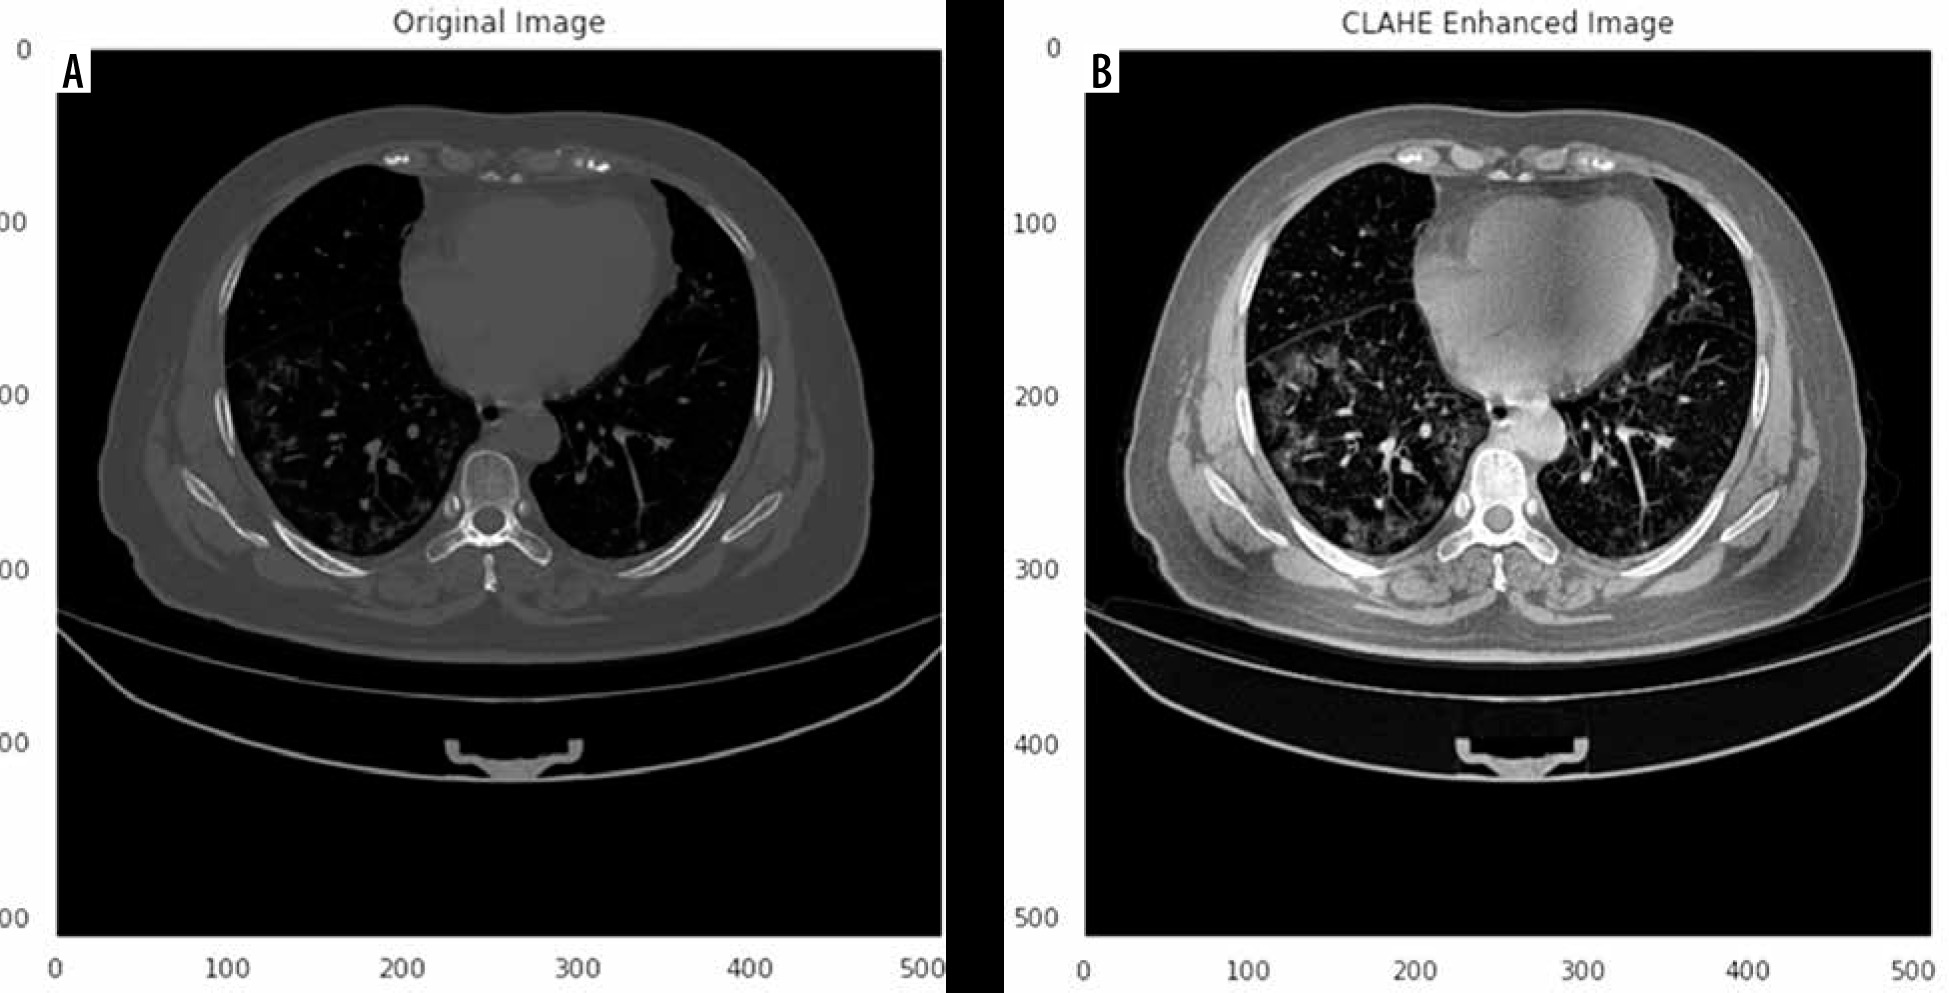
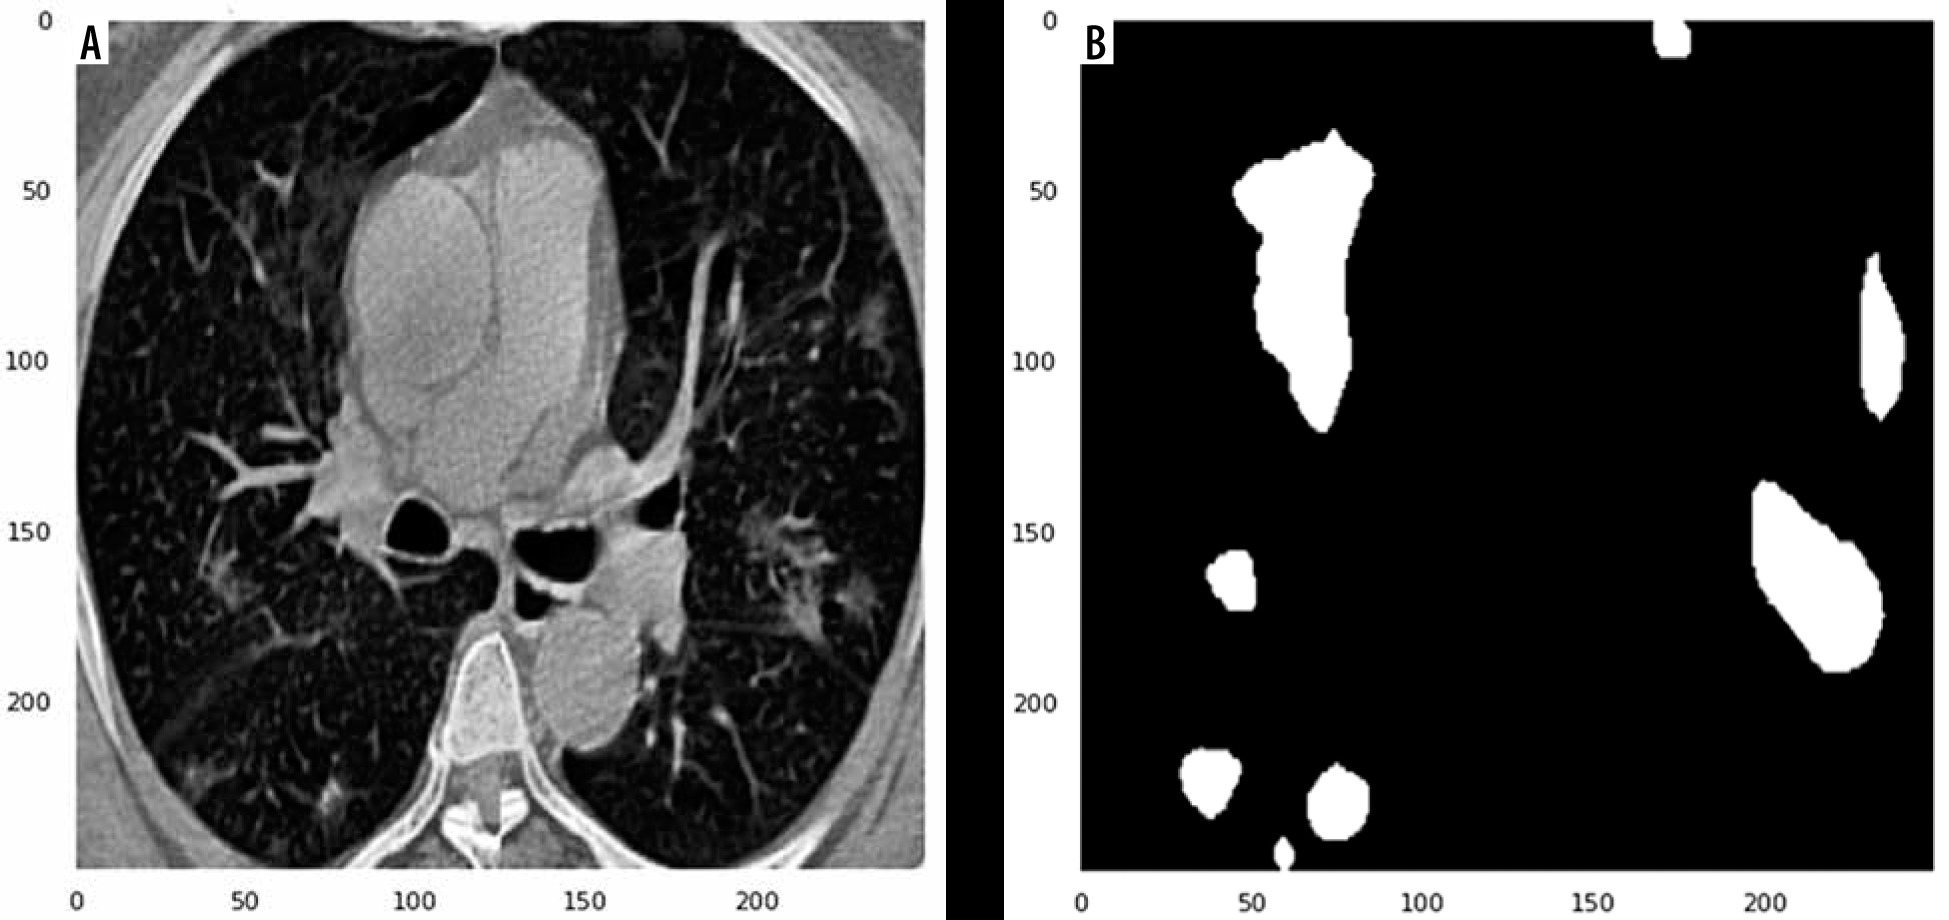
Herein, we employed image pre-processing techniques on collected CT images to enable the dataset of images to be properly analysed by the proposed deep-learning models. Hence, several pre-processing techniques were applied on the image dataset to increase image quality by enhancing contrast and standardizing pixel intensity values. Initially, we manually removed some CT slices from the dataset that were not related to the lung (e.g. neck or abdomen). The contrast limited adaptive histogram equalization (CLAHE) technique was employed to enhance image contrast, as shown in Figure 3. Also, we cropped the CT images to extract lung region, i.e. removing the unwanted irrelevant areas from the chest CT images. Of note, the corresponding binary mask for each image was cropped in the same way (Figure 4). For memory capacity limitation and to reduce the pre-processing time, all CT images and binary masks were resized to 224 × 224 pixels. Moreover, image pixel intensity levels were norma-lized to the [0, 1] range.
Segmentation model
Numerous image segmentation algorithms have been developed and widely applied in the literature; however, deep CNN-based models for COVID-19 lesion segmentation have shown promising results. In this study, for the semantic segmentation task, 3 widely used and well-known deep CNN-based segmentation models: 2D U-Net [22], 2D U-Net++ [23], and 2D Res-Unet [24], were applied without any custom modification.
U-Net, a deep CNN model, proposed in 2015 by Ronneberger et al. [22], is currently a widely used and promising architecture used in medial image segmentation. The U-Net architecture is a U-shaped structure with an encoding path and parallel symmetric decoding path, which down-samples and up-samples the input images. In other words, U-Net has a contracting path (i.e. encoder) for capturing context features and an expansive path (i.e. decoder) for fusing features (i.e. precise location). U-net employs skip connections (shortcuts) to connect the same layer in the contracting and expansive paths, which allows the network to better learn visual semantics. U-Net utilizes 4 down-sampling and 4 up-sampling. Up-sampling is performed by transposed convolution and down-sampling by max pooling.
In 2018, Zhou et al. [23] proposed U-Net++, which is a new, more effective segmentation architecture in medical images. U-Net++, as a much more complicated model than U-net, consists of deeply supervised encoder-decoder sub-networks that are connected through a series of nested, dense, redesigned skip pathways. Three components distinguish U-Net++ from the original U-Net: 1) using convolution layers on skip pathways, which results in reducing the semantic gap between the feature maps of the encoder and the decoder; 2) the use of dense skip connections on skip pathways, resulting in the improvement of gradient flow; and 3) having deep supervision, thereby pruning U-Net++ at inference time, which can improve or, in the worst case, obtain comparable performance to using only one loss layer. The use of deep supervision results in more accurate segmentation, especially for lesion areas.
The Res-Unet (deep residual U-Net), a semantic segmentation neural network proposed in 2017 by Zhang et al. [24], is an improved version of U-Net, which comprises an encoder-decoder assembly and residual neural network. In the Res-Unet architecture, several plain neural convolution layers of U-Net are replaced with residual units. Also, the cropping operation is removed from Res-Unet architecture, which leads to a much more elegant architecture and improves performance. This semantic segmentation neural network has 2 benefits over U-Net and the residual neural network: 1) the use of the residual unit leads to easy network training; 2) the skip connections within a residual unit and between low levels and high levels of the network facilitate information propagation without degradation, which results in designing a neural network with far fewer parameters; however, it can improve or achieve comparable performance on semantic segmentation. Overall, the Res-Unet network consists of 3 parts: 1) encoding, 2) bridge, and 3) decoding.
Training
In this study, we trained 2D CNN models from scratch. The dataset was split into 80% for training and validation and 20% for testing the proposed models. In the training step, we utilized the Dice coefficient as the loss function, known as Dice loss [25]. All 2D deep CNN models were trained for 250 epochs with an initial learning rate of 0.0005 with an Adaptive Moment Estimation (Adam) optimizer [26] and a batch size of 32. We used the Python library for training, validation, and testing of the proposed CNN models. All experiments were conducted on a standard PC with a GeForce GTX 8 GB NVIDIA and 32 GB RAM.
Evaluation metrics
Evaluation metrics have a critical role in evaluating the outcomes of segmentation models. We assessed the performance of the proposed models using the Dice similarity coefficient (DSC), average symmetric surface distance (ASSD), mean absolute error (MAE), sensitivity, specificity, and precision. The DSC measures the overlap between radiologist-drawn contours as ground truth and the auto-delineated contours [27,28]. Larger DSC values (maximum value of 1) represent greater similarity between the automatic segmentation and ground truth. The ASSD, as a shape similarity index, is the average difference of all the distances between the surface of the segmented object and the ground truth segmentation mask [27,28]. Lower values of the ASSD (minimum value of 0 for perfect segmentation) indicate greater agreement between the auto-segmented contours and ground truth. The MAE determines the pixel-wise difference between the predicted contours and ground truth [29].
where R and R0 represent the manually outlined mask and the automatically segmented mask, respectively.
where d (r, r0) indicates the Euclidian distance between the 2 voxels, r and r0 are the surface points of R and R0, respectively, and NR and NR0 represent the number of surface voxels on R and R0, respectively.
where w and h are the width and height, respectively, of ground truth R. And (i, j) denotes the coordinates of each pixel in R.
To compute the sensitivity, specificity, and precision, we generated a confusion matrix, in which TP, FP, TN, and FN indicate true positive, false positive, true negative, and false negative, respectively.
Results
Table 1 summarizes the values of segmentation quantification metrics in terms of Dice, ASSD, MAE, sensitivity, specificity, and precision for COVID-19 lesions on the COVID-19-CT-Seg-Dataset. As shown in Table 1, all models provide good performance for COVID-19 lesion segmentation. Compared with Res-Unet, the U-Net and U-Net++ models achieve better results, with a mean Dice value of 85.0%, as outlined in Table 1. Compared with all models, U-Net gains the highest segmentation performance, with 86.0% sensitivity and 2.22 mm ASSD. The U-Net model obtains 1%, 2%, and 0.66 mm improvement over the Res-Unet model in the Dice, sensitivity, and ASSD, respectively. Compared with Res-Unet, U-Net++ achieves 1%, 2%, 0.1 mm, and 0.23 mm improvement in the Dice, sensitivity, ASSD, and MAE, respectively. Figure 5 shows the Dice similarity index, ASSD, and MAE boxplots for COVID-19 lesion segmentation.
Table 1
Quantitative performance metrics of U-Net, U-Net++, and Res-Unet models for COVID-19 lesion segmentation on the COVID-19-CT-Seg-Dataset (mean ± SD)
Figure 5
Boxplots of quantitative metrics for U-Net and U-Net++, and Res-Unet models for COVID-19 lesion segmentation, including (A) Dice similarity coefficient (%), (B) ASSD (mm), and (C) MAE (mm). In each panel, the bold line represents the median, the boxes represent the 25th and 75th percentiles, and whiskers represent ranges not including outliers. The individual point is considered as an outlier
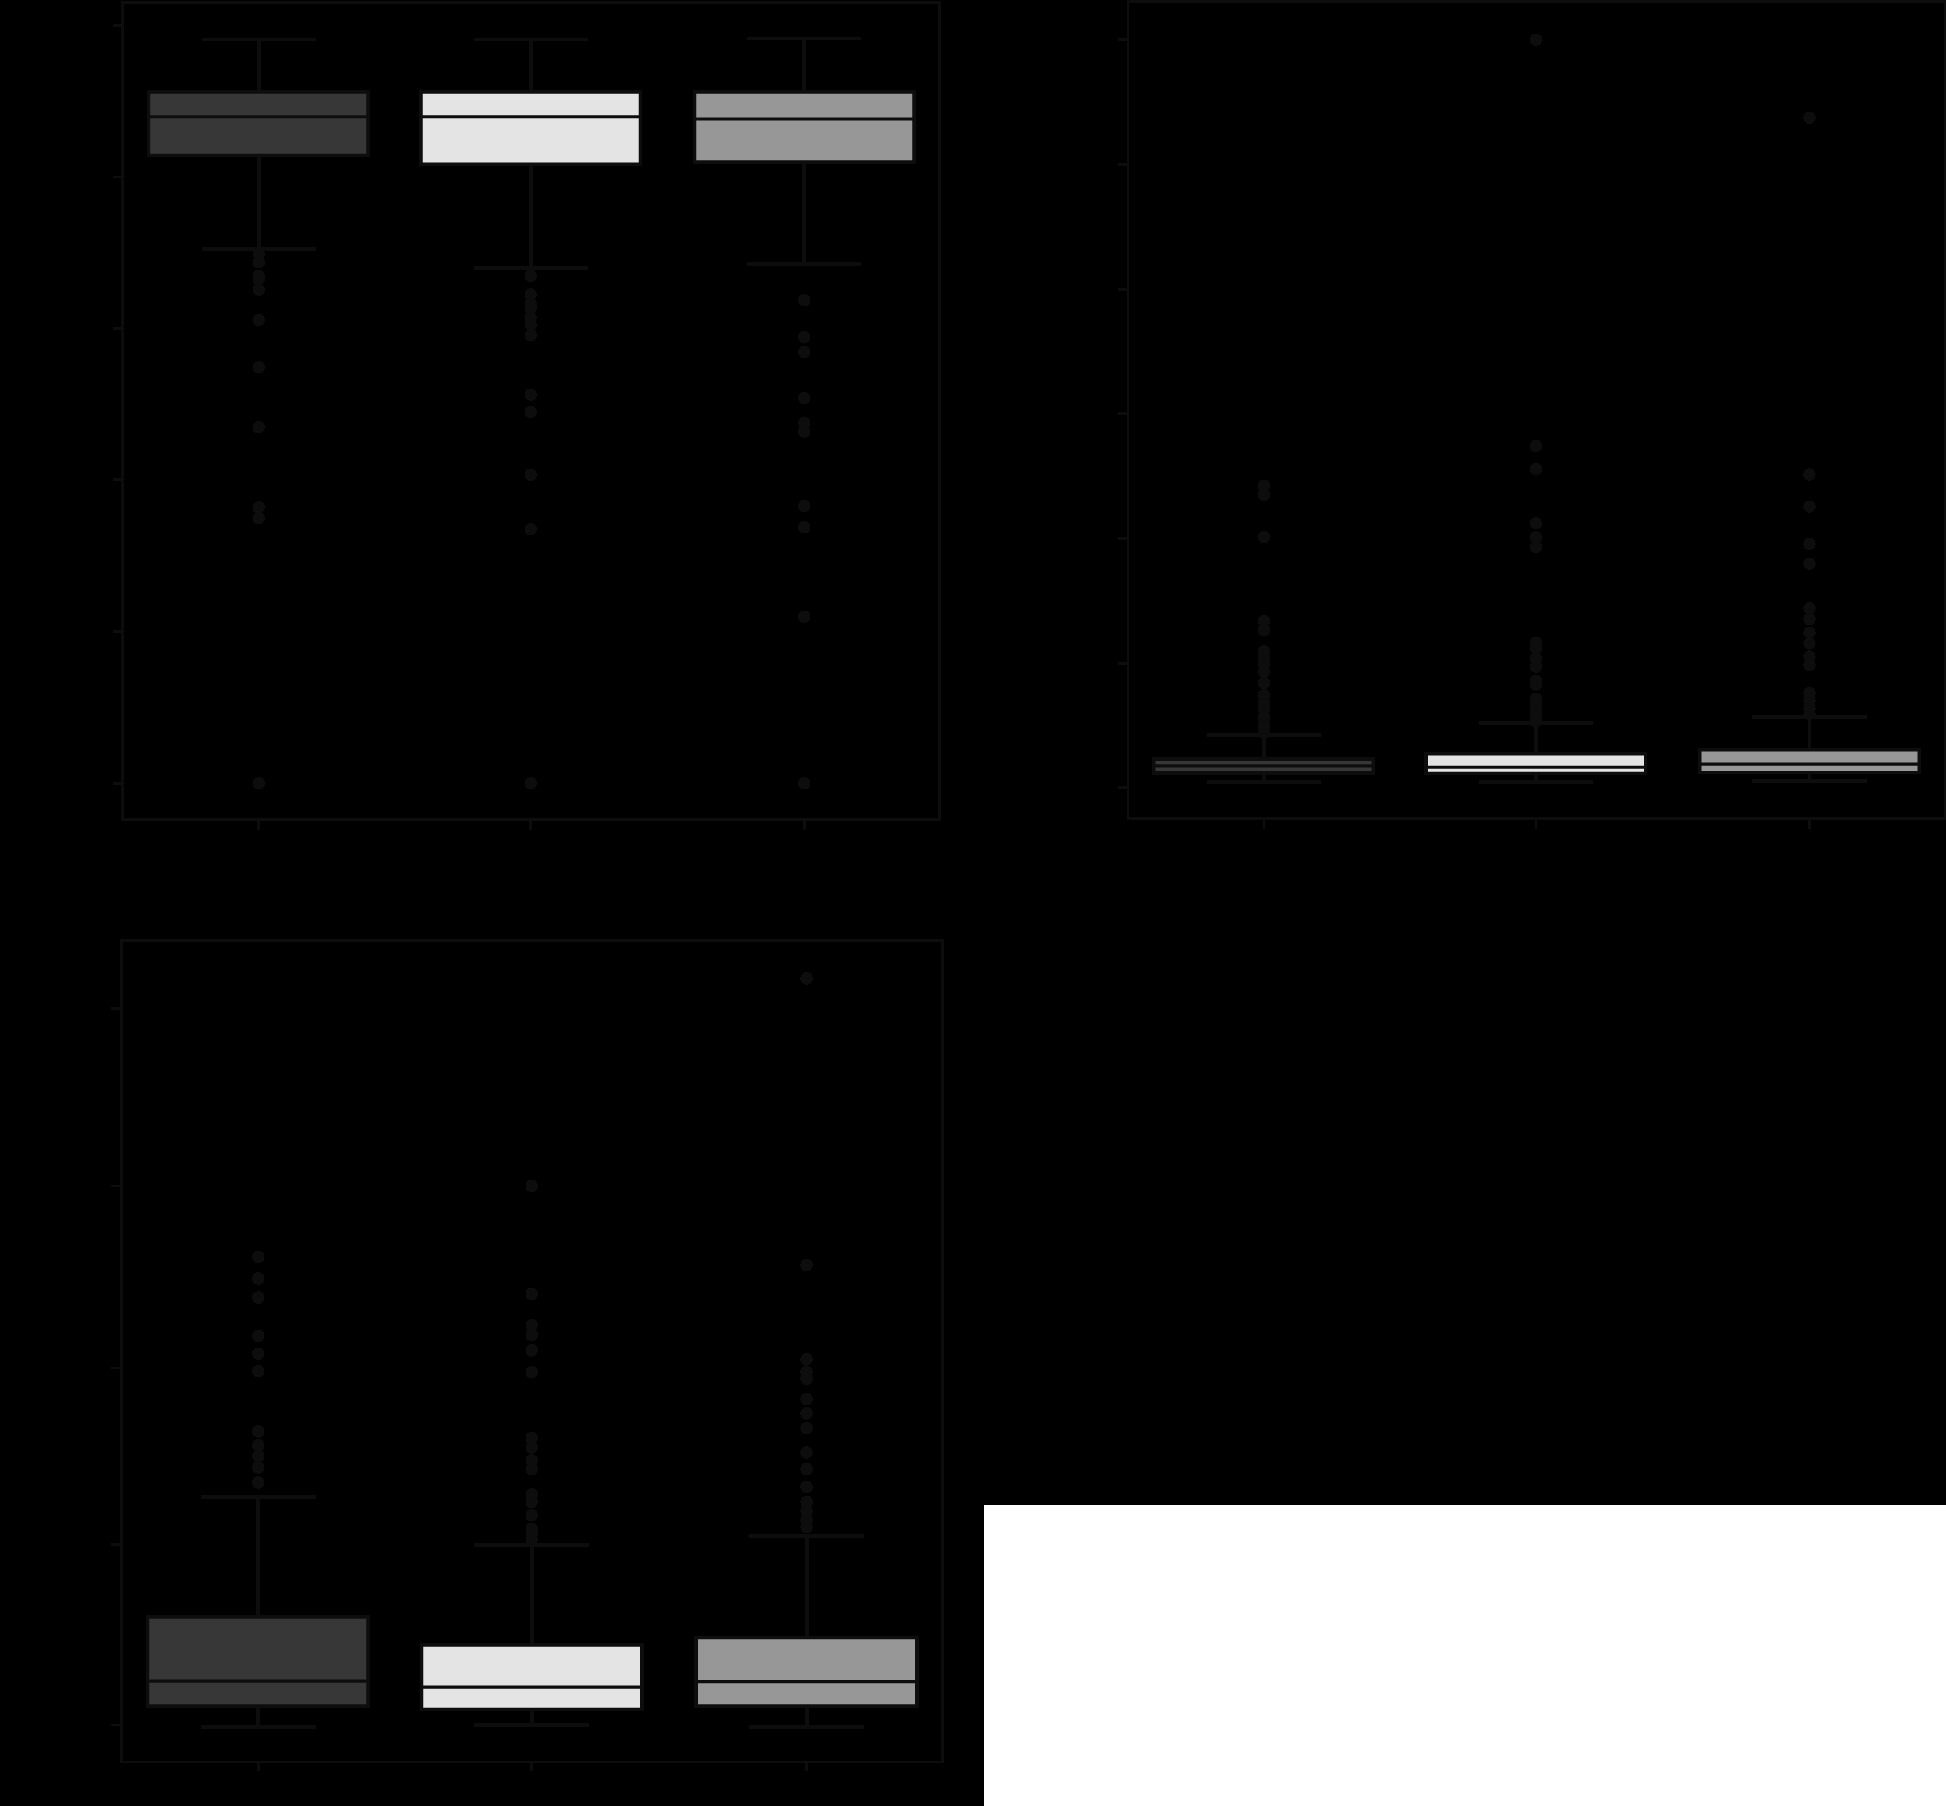
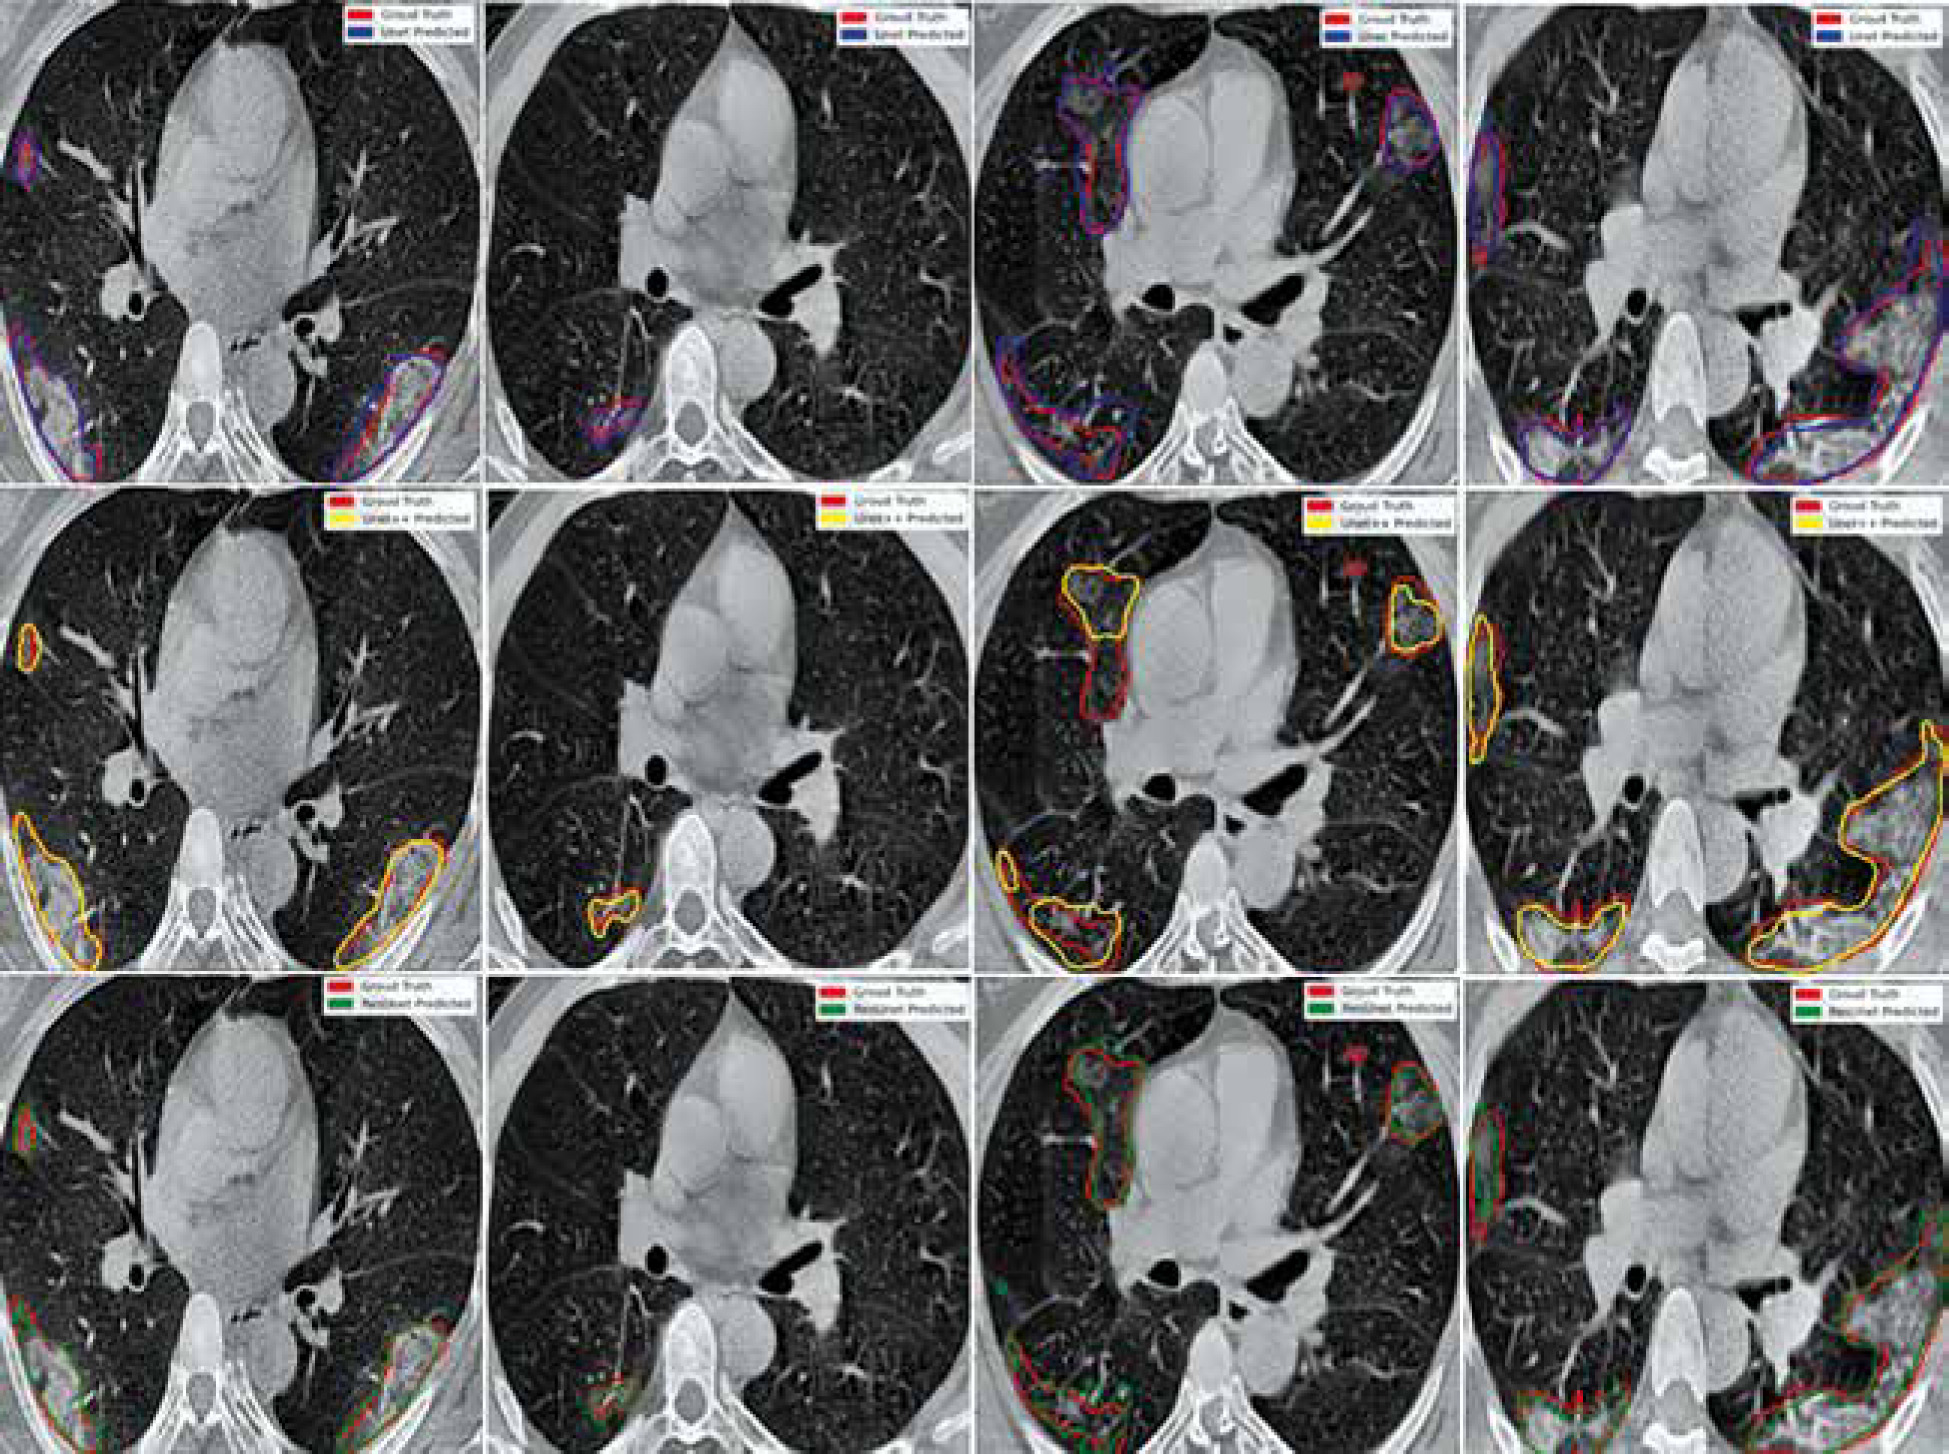
Figure 6 shows the ground truth and predicted segmentation of COVID-19 lesions from the COVID-19-CT-Seg-Dataset. Overall, there is good agreement between COVID-19 lesions delineated by clinicians (i.e. reference) and the deep CNN models in CT images, as shown in Figure 6. Visually it reveals that the U-Net model detected the COVID-19 lesion regions more precisely than other deep CNN-based auto-segmentation models. As observable in Figure 6, U-Net can reduce the area of the false negative regions, but it does not restrict the enlargement of the false positive areas, as compared with U-Net++ and Res-Unet. The U-Net++ model has the smallest area of false positive regions over the U-Net and Res-Unet models, as depicted in Figure 6. The proposed models did not segment areas with very small lesions. As shown in Figure 6, the proposed models were able to distinguish COVID-19 lesions from the chest wall.
Discussion
In this study, we evaluated 2D deep CNN-based algorithms for automated segmenting COVID-19 lesions from chest CT images. The performance of the offered algorithms was assessed using the commonly used assessment scores such as Dice, ASSD, MAE, sensitivity, specificity, and precision. When testing our models on the COVID-19-CT-Seg-Dataset, our proposed models achieved Dice index, sensitivity, specificity, and precision greater than or equal to 84.0%, 84.0%, 99.0%, and 85.0%, respectively.
Chest CT scans play a potential role in both the dia-gnosis and management of COVID-19 patients [30]. Several studies have emphasized that CT imaging can be used as a useful prognostic tool in COVID-19 pneumonia [30,31]. However, a challenging issue in connection with the use of CT in COVID-19 management is accurate segmentation of infectious COVID-19 lesions. Of note, in current clinical practice, delineation of COVID-19 lesions is manual, tedious, and time-consuming work performed by radiologists. Furthermore, annotation of CT images by experts is a highly subjective task, often highly influenced by personal bias and clinical experiences [13,14]. In other words, providing reference (i.e. ground truth) segmentation for the segmentation of COVID-19 lesions is challenging due to inter-rater/intra-rater variability and noisy annotations, as well as the long processing time [32]. In this regard, artificial intelligence algorithms, especially machine learning and deep learning approaches, offer a helpful tool for segmentation of COVID-19 lesions regions as clinical decision support for radiologists.
Herein, a 2D deep learning framework was proposed and implemented for the segmentation of COVID-19 lesions in a fully automated pipeline. It has been demonstrated that deep learning is capable of achieving superior performance in the field of radiology [19,33,34]. A large number of studies have applied deep-learning algorithms to automatically diagnosis COVID-19 pneumonia from chest X-ray and CT images [19,35,36]. Also, several previous studies attempted to develop and implement auto-segmentation algorithms for COVID-19 infection regions from CT images. A study by Müller et al. applied a standard 3D U-Net model using data augmentation for generating unique and random image patches during training for lung and COVID-19 lesion segmentation on 20 annotated CT scans of COVID-19 patients [37]. Their proposed model obtained a Dice value of 95.0% for lungs and 76.1% for COVID-19 lesions [37]. Also, Ma et al. first provided a COVID-19 3D CT dataset (70 annotated COVID-19 cases) and then implemented the 3D U-Net architecture as a baseline for benchmarking, reporting a Dice value of 60.7% for COVID-19 lesion segmentation [38]. In another study, Yan et al. proposed a modified 3D U-Net (COVID-SegNet) for lung and COVID-19 infection segmentation on 21,658 chest CT images from 861 COVID-19 cases [39]. The COVID-SegNet achieved a Dice, sensitivity, and precision of 72.6%, 75.1%, and 72.6% for lesion segmentation, respectively [39]. Chen et al. applied the residual attention U-Net for automated segmentation of COVID-19 chest CT images, achieving a Dice value of 94.0% for the segmentation of COVID-19 lesions [40]. In addition, other research groups proposed specifically designed architectures for COVID-19 lesion segmentation [41-43]. Fan et al. proposed a novel COVID-19 lung CT infection segmentation network, called Inf-Net, which uses an implicit reverse attention and explicit edge-attention, resulting in the improvement of the identification of infected regions [41]. The Inf-Net architecture achieved a Dice of 76.4% for COVID-19 infection segmentation on 2D CT scans [41]. Qui et al. proposed a lightweight (83K parameters) deep-learning model for efficient COVID-19 segmentation, named MiniSeg, which trained on 2D CT scans and achieved a Dice value of 77.3% for COVID-19 infection segmentation [42]. Pei et al. proposed a multi-point supervision network (MPS-Net), a 2D deep-learning-based approach, to automatically segment the lesions areas of COVID-19 in chest CT images [43]. Their proposed model achieved high performance, with Dice, sensitivity, and specificity of 83.2%, 84.0%, and 99.8%, respectively [43]. As shown in Table 1, our proposed 2D deep CNN-based auto-segmentation algorithms indicated good performance compared to the aforementioned studies for COVID-19 pneumonia infectious lesions.
The current auto-segmentation methods in research achieve promising results in COVID-19-infected region segmentation. It should be noted, however, that the majority of these approaches, including ours, are not suitable for clinical usage (i.e. real application) without a second check by a radiologist. It is worth mentioning that the majority of current auto-segmentation methods are only trained with COVID-19-related images. Of note, there are similar imaging features between COVID-19 lesions and non-COVID-19 viral pneumonias, bacterial pneumonia, etc. Therefore, these models cannot differentiate COVID-19 lesions from other pneumonia, or even cancer. Our proposed models focused on infected region segmentation for COVID-19 patients. It is important to notice, however, that in routine clinical practice, it is often required to first detect and classify COVID-19 patients and then segment lung lesion areas for further treatment and management. Thus, further study will be required to develop an artificial intelligence automatic diagnosis framework to integrate detection and lung infection segmentation of COVID-19. Furthermore, a relatively small training dataset was used in the present study. A larger dataset collected from several institutions and countries will be required to generate a more stable model. Also, the performance of the models varies greatly depending on which dataset they were trained with. In the presence of other respiratory conditions, auto-segmentation methods purely based on COVID-19 CT scans often cannot segment the lesions with good accuracy [38]. Nevertheless, for confirmed COVID-19 imaging, the current auto-segmentation approaches have high accuracy.
Conclusions
In this study, we proposed a 2D deep-CNN-based framework to automatically segment COVID-19 lesion in chest CT images. The performance of 3 deep learning networks (U-Net, U-Net++, and Res-Unet) in segmenting COVID-19 infected regions was compared. Our results showed that the proposed models achieve comparable performance. However, U-Net and U-Net++ outperformed Res-Unet. The qualitative results demonstrated the ability of all proposed networks to distinguish between COVID-19 lesions and chest wall. Our results show promising prospects for the possibility of application of deep-learning approaches to assist in segmenting COVID-19 lesions on chest CT images. The segmentation results of the proposed networks can help radiologists in faster screening and quantification of lesion regions for further treatment. Nevertheless, further studies are required to evaluate the clinical performance and robustness of the proposed models on COVID-19 semantic segmentation.